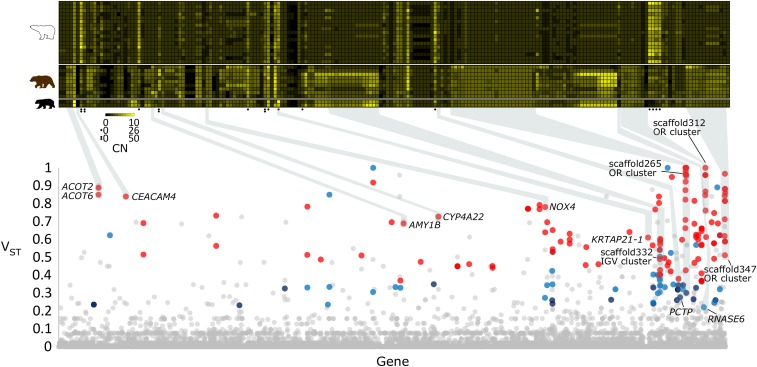
Fig. 1.
Genes with differentiated CN profiles between polar bear and brown bear. (Lower) A Manhattan plot of VST values (y axis) for each gene (n = 21,142) (x axis) in the reference polar bear genome. Genes are depicted by their VST value patterns across the Control-FREEC and BDN CN estimations: red = VST > 0.35 in both CN estimation methods, purple = VST > 0.22 and VST ≤ 0.35 in both CN estimation methods, blue = VST > 0.22 in one CN estimation method and VST > 0.35 in the other CN estimation, and gray = VST ≤ 0.22 in at one or both CN estimation methods. Genes of interest are labeled according to their respective human annotations, and are highlighted with gray boxes. (Upper) A heat map of diploid gene CN (columns) for each of the 197 differentiated genes in the 17 polar bear individuals, 9 brown bear individuals, and 2 black bear individual (rows). Genes with black circle notations represent high-CN genes and have different scales (see key). Black and yellow represent a CN of zero, and a high CN (8 or 50 depending on scale), respectively. Polar bear gene identifiers, along with either human or dog annotations when available, are noted for each gene. CNs are from Control-FREEC estimates. Individual samples identifiers and gene identifiers are provided in Dataset S1.

