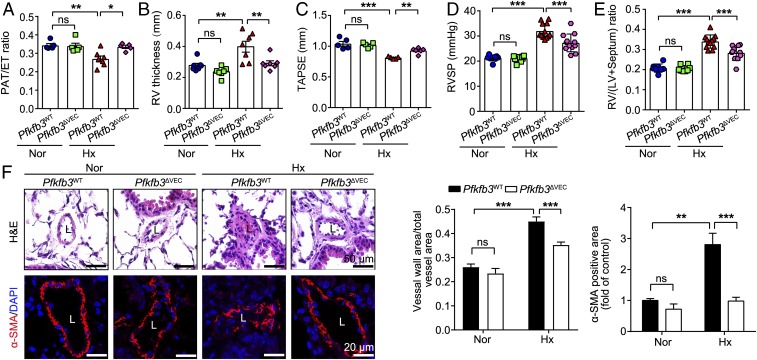
Fig. 4.
Endothelial-specific Pfkfb3 deficiency in mice ameliorates the development of hypoxia-induced PH. (A–C) Quantification of PAT/ET ratio (A), RV thickness (in millimeters) (B), and TAPSE (in millimeters) (C). (D) Quantification of RVSP and (E) RV hypertrophy as assessed by RV/LV+septum. (F) (Left) Representative images of H&E staining and α-SMA immunostaining of the distal pulmonary arteries of Pfkfb3WT and Pfkfb3ΔVEC mice under normoxic (Nor) or hypoxic (Hx) conditions for 4 wk and (Right) quantification of pulmonary artery thickness as measured by the ratio of vessel wall area to total vessel area and α-SMA immunostaining-positive area. L, lumen (n = 6). All data are expressed as mean ± SEM. Statistical significance was determined by one-way ANOVA followed by Bonferroni test. *P < 0.05 was considered significant, **P < 0.01, ***P < 0.001. ns, no significance.

