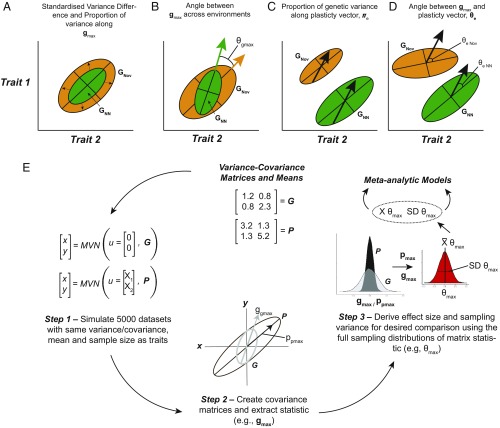
Fig. 6.
(A–D) Examples of the different effect size measures describing changes in G and P within and across nonnovel (green-“NN”) and novel (orange-“Nov”) environments. While both G and P were compared to each other, and themselves, within and across environments, we present effect sizes comparing G matrices only for simplicity. See text for more details. (E) Schematic example of the Monte Carlo simulations used to generate effect sizes and corresponding sampling variance described in A–D.

