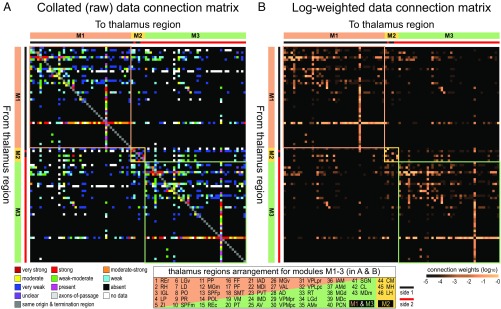
Fig. 1.
Bilateral rat intrathalamic macroconnectome (TH2). (A and B) Directed and weighted monosynaptic macroconnection matrices with gray matter region sequence in a subsystem (modular) arrangement derived from multiresolution consensus clustering (MRCC) analysis (Fig. 6). Connection weights are represented by descriptive values (A) and on a log10 scale derived from the descriptive values (B), and both measures are represented for identical datasets for each side of the thalamus. Sides 1 and 2 (left or right) are indicated by the thick red/black lines just to the left and on top of each matrix. 3 top-level subsystems (modules M1–3) are delineated: M1 and M3 involve unilateral connections (within side 1 or side 2), and M2 involves bilateral connections (within and between sides). The obvious crosses formed by a single row and column in M1 and M3 represent connections of the reticular thalamic nucleus. Region abbreviations are defined in Dataset S2.

