Fig. 4.
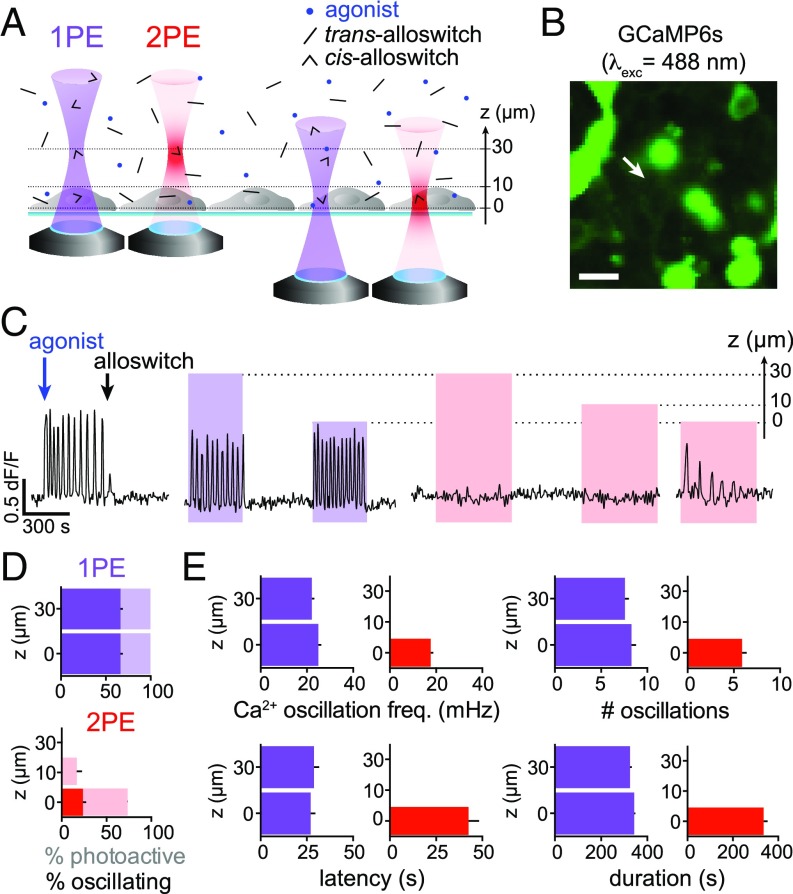
Two-photon excitation of alloswitch in free-diffusion medium enables axially resolved photoactivation of mGlu5. (A) Experimental design. Light is focused at different axial distances (Z = 30, 10, or 0 µm) upwards from the cell focal plane in an inverted microscope. Single-photon excitation of alloswitch stimulates mGlu5 on cells at any axial distance, whereas 2PE of alloswitch is effective only when light is focused at the cell plane (Z = 0). (B) HEK cells expressing GCaMP6s for Ca2+ imaging. Arrow indicates cell recorded in C (Movie S2). (Scale bar, 20 µm.) (C) Representative trace (cell indicated by arrow in B) showing that photoactivation of Ca2+ responses occurs regardless of the focal plane with 1PE of alloswitch, and is focal-plane (Z = 0) -selective with 2PE. Ca2+ oscillations were elicited by mGlu5 agonist (quisqualate, 3 µM; blue arrow) and blocked by alloswitch (1 µM; black arrow). Light for alloswitch excitation is focused above the Ca2+-imaging plane at indicated axial distances (Z, µm). See imaging and stimulation conditions in SI Appendix. (D) Percentages of responsive cells with 1PE (Upper) or 2PE (Lower) at indicated Z positions, shown as percent of photoactive (positive Ca2+ changes; faint colors) and percent showing oscillatory behavior (solid colors). All photoactive cells responded to 1PE regardless of Z, and 66 ± 3% of them displayed an oscillatory phenotype. With 2PE at the focal plane (0 µm): photoactive cells, 73.0 ± 0.3%; oscillating cells: 24 ± 4% (36% of the cells found to oscillate at 1PE). With 2PE 10 µm above: photoactive cells, 17 ± 6%. Two-photon excitation at axial distances of 10 or 30 µm induced no oscillations. n = 67 cells from 2 independent experiments. See full dataset in SI Appendix, Fig. S4E. (E) Quantification of the oscillatory behavior of cells in D as Ca2+ oscillation frequency (Upper Left), number of oscillations (Upper Right), latency to the first oscillation after illumination onset (Lower Left), and overall duration (Lower Right). When photoactivating at Z = 0, the oscillation frequency was lower at 2PE than 1PE (18 ± 1 and 25 ± 1 mHz, respectively, P < 0.01), as well as the number of oscillations achieved (5.9 ± 0.5 and 8.3 ± 0.5, P < 0.05), whereas the latency was longer in trend (42 ± 6 and 27 ± 3 s, P = 0.25), and the duration unaffected. Cell responses were similar for 1PE at all axial distances. Data are mean ± SEM; Kruskal–Wallis test with Dunn’s correction. Single-photon excitation, n = 45 from 2 independent experiments; 2PE, n = 27 from 3 independent experiments. See full dataset and statistics in SI Appendix, Fig. S4F.

