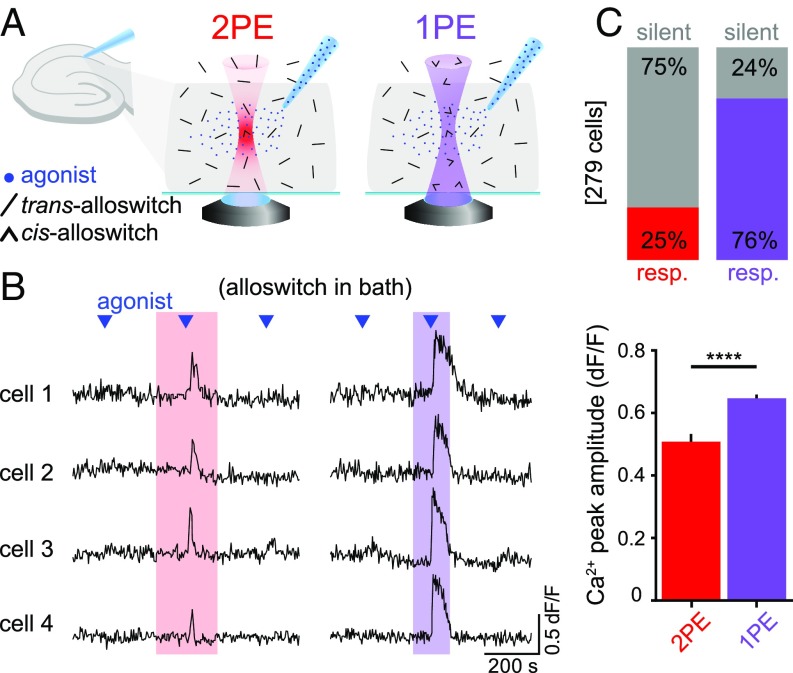
Fig. 6.
Efficiency of mGlu5 activation using 1PE and 2PE of alloswitch in a 3D tissue. (A) Schematics of the experimental design. Trans-alloswitch in bath (mGlu5-block) is photoconverted to cis-alloswitch (mGlu5-block is released) along the volume of brain slice illuminated by the light cone of 1PE (violet) or in the focal spot of 2PE (red). Pipette for delivery of mGlu5 agonist (DHPG) is placed on top of imaged cells in the CA1 region of the hippocampus. (B) Example traces of 4 recorded cells with alloswitch in bath, comparing the Ca2+ responses to agonist puffing (blue triangles) before, during, and after 2PE (Left, red box) or 1PE (Right, violet box) of alloswitch. Single- and double-photon excitation were achieved with 2 (1PE) or 3 (2PE) consecutive raster scans at a frequency of 0.4 Hz and 0.26 Hz, respectively, with pixel dwell time of 2.5 µs, and laser power of 58 µW (1PE) and 25 mW (2PE). Ca2+ traces are shown as changes in OGB-1 fluorescence (dF/F; excited at 488 nm, 1.7–5.2 µW). See for imaging/photostimulation schematics and for control trace without alloswitch in SI Appendix, Fig. S5B. (C) Quantification of cell responses to agonist puffing from experiments as in B. (Upper) Percentage of responding (colored) and silent (gray) cells during 2PE (red) or 1PE (violet) of alloswitch. Cells are shown as percentages of the total number of OGB-1–labeled cells detected in the imaged area (0.1 mm2). (Lower) The average peak amplitude of Ca2+ responses to 2PE in cells shown as responding in top graph (n = 69 cells, 3 animals) was about 15% lower (****P < 0.0001, unpaired t test) than the amplitude of 1PE responses (n = 212 cells, 3 animals). Data are mean ± SEM.

