Fig. 1.
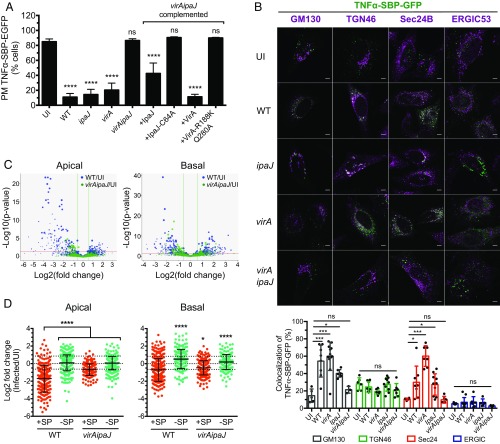
S. flexneri effectors IpaJ and VirA have a global effect on conventional secretion. (A) IpaJ and VirA effectors block the anterograde transport of the cytokine TNFα. HeLa cells stably expressing the RUSH cargo TNFα-SBP-GFP and the molecular hook streptavidin-KDEL were uninfected (UI) or infected for 1 h with WT-dsRed or the dsRed-expressing mutants ipaJ, virA, virAipaJ, or with virAipaJ complemented with pIpaJ-myc, pIpaJ-C64-myc, pVirA-myc, or pVirA-R188K/Q280A-myc. Cells were then incubated with biotin for 1 h, fixed, and surface-stained for TNFα-SBP-GFP with anti-GFP DyLight 680-conjugated antibody. The arrival of TNFα-SBP-GFP to the plasma membrane (PM) was monitored by FC. Mean ± SD. n = 3. ****P < 0.0001; ns, nonsignificant (one-way ANOVA, Dunnett’s post hoc test, compared with UI). (B) TNFα-SBP-GFP is retained in different subcellular compartments upon S. flexneri infection. HeLa cells stably expressing the RUSH cargo TNFα-SBP-GFP and the molecular hook streptavidin-KDEL were uninfected (UI) or infected for 1 h and incubated with biotin for 1 additional hour. Cells were fixed, permeabilized, and stained with various subcellular markers: anti-GM130 (cis-Golgi), anti-ERGIC53 (ERGIC), anti-Sec24B (ERES), and anti-TGN46 (trans-Golgi network). (Scale bar: 5 µm.) Levels of colocalization between TNFα-SBP-GFP and the different subcellular markers were quantified by SODA plugin in ICY software. Mean ± SD. 5 < n < 12 cells. *P < 0.05; ***P < 0.001 (one-way ANOVA, Dunnett’s post hoc test). (C and D) S. flexneri blocks globally the host conventional secretion. Caco-2/TC7 cells were labeled with SILAC amino acids, grown in Transwell filters, and infected with WT S. flexneri or the mutant virAipaJ. After 4.5 h, the apical and basal media were collected and analyzed by mass spectrometry to determine the relative abundance of secreted proteins in the infected, in comparison with UI, samples. (C) Volcano plots displaying log2 fold changes of secreted proteins from WT or virAipaJ-infected cells in comparison with UI conditions in apical and basal media. (D) Dot plots represent log2 of infected/UI ratio for proteins with (red) and without (green) signal peptide (SP). Mean ± SD. 217 > n > 394 proteins for apical secretome; 194 > n > 281 proteins for basal secretome. *P < 0.05, ****P < 0.0001 [one-way ANOVA, Dunnett’s post hoc test, each condition compared with apical or basal secreted proteins containing signal peptide (+SP)].

