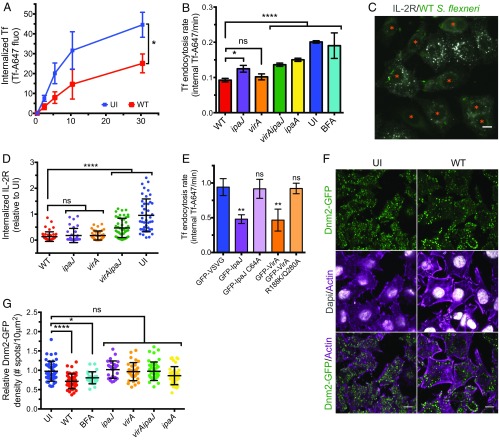
Fig. 3.
S. flexneri affects clathrin-dependent and -independent endocytosis. (A) Tf uptake is decreased upon WT infection. Hep2 cells were left uninfected (UI) or infected with the WT strain for 30 min, and then incubated for different time points with Tf-AF647 at 37 °C. After an acidic wash, the total internal Tf-AF647 fluorescence was quantified by FC. Mean ± SD. n = 4. *P < 0.05 (unpaired two-tailed Welch’s t test performed on area under the curve). (B) Different S. flexneri effectors decrease the Tf endocytosis rate. Hep2 cells were left UI or infected with GFP-expressing WT or mutant strains for 90 min, before monitoring by FC the Tf-AF647 uptake over time. Mean ± SD. n 3. (C and D) IL-2R endocytosis is decreased upon WT S. flexneri infection. (C) UI or WT-infected Hep2β cells were incubated with an anti–IL-2Rβ-Cy3 antibody for 15 min at 37 °C, fixed, and subjected to fluorescent microscopy. (Scale bar: 10 µm.) (D) Quantification of IL-2R endocytosis. Cells either UI or infected by WT, ipaJ, virA, and virAipaJ S. flexneri strains for 90 min were incubated with an anti–IL-2Rβ-Cy3 antibody for 30 min at 37 °C, fixed, subjected to confocal fluorescence microscopy, and analyzed by quantifying the fluorescence intensity of IL-2R–positive vesicles per cell. Mean ± SD. 35 < n < 48 cells. (E) Tf endocytosis is inhibited by IpaJ and VirA catalytic activities. Cells were transfected with GFP-VSVG (control), GFP-VirA, GFP-IpaJ, or their mutated versions GFP-VirA-R188K/Q280A and GFP-IpaJ-C64A. Tf endocytosis kinetic was performed 24 h posttransfection. Mean ± SD. n = 3. (F and G) S. flexneri decreases Dnm2-GFP density at plasma membrane. Hep2β Dnm2-GFP cells were UI, treated with BFA for 30 min, or infected with WT or mutant strains for 90 min. Cells were fixed and labeled with rabbit anti-LPS followed by anti–rabbit-A405 and phalloidin-A647 before confocal (F) or TIRF (G) imaging. (Scale bar: 10 µm.) (G) Quantification of Dnm2-GFP density (number of Dnm2-GFP spots/area) at plasma membrane from TIRF microscopy images. Mean ± SD. 27 < n < 45 cells pooled from two independent experiments. (B, D, E, and G) ns, nonsignificant; *P < 0.05; **P < 0.01; ****P < 0.0001 (one-way ANOVA, Dunnett’s post hoc test).

