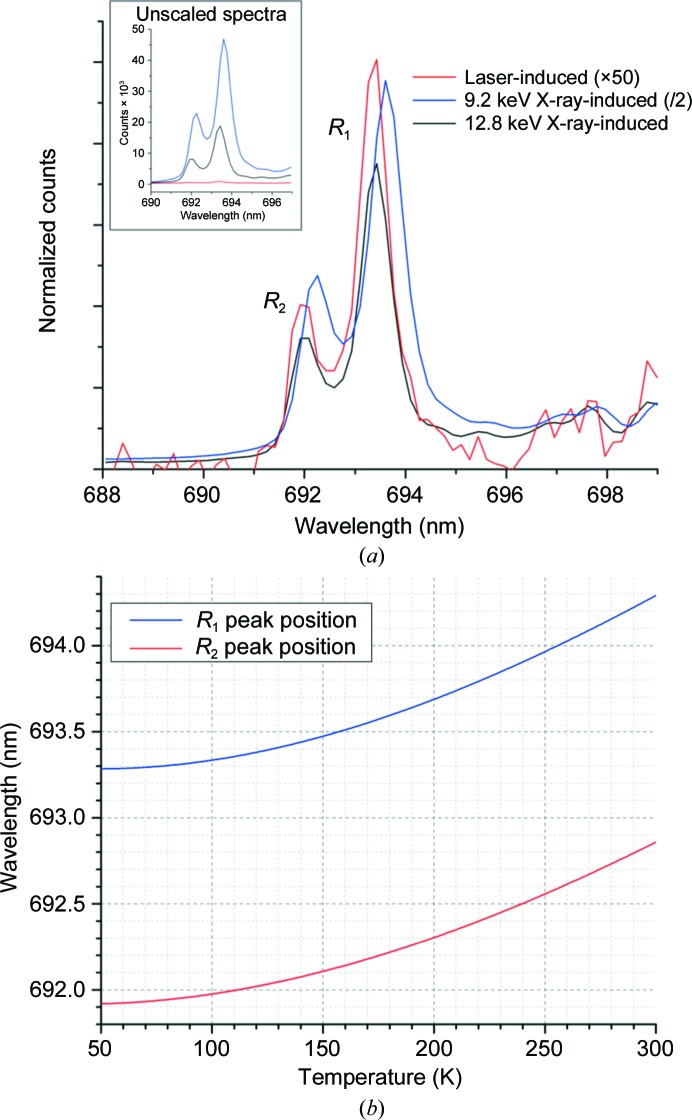
Figure 2.
(a) Laser- and X-ray-induced fluorescence of ruby, showing peak shifts and the relative intensity of laser- and X-ray-induced spectra. In addition to being red-shifted, the R 1 and R 2 peaks become broader at higher temperatures. The inset shows the unscaled spectra. (b) Calibration curve showing the position in wavelength of the ruby R 1 and R 2 fluorescence peaks obtained from (2) and (3). Note that the cubic function has a stationary point at 50 K (R 1) and 40 K (R 2), so temperatures below this would result in a peak with the same wavelength at a higher temperature. Temperatures below 80 K were not investigated as part of this study.

