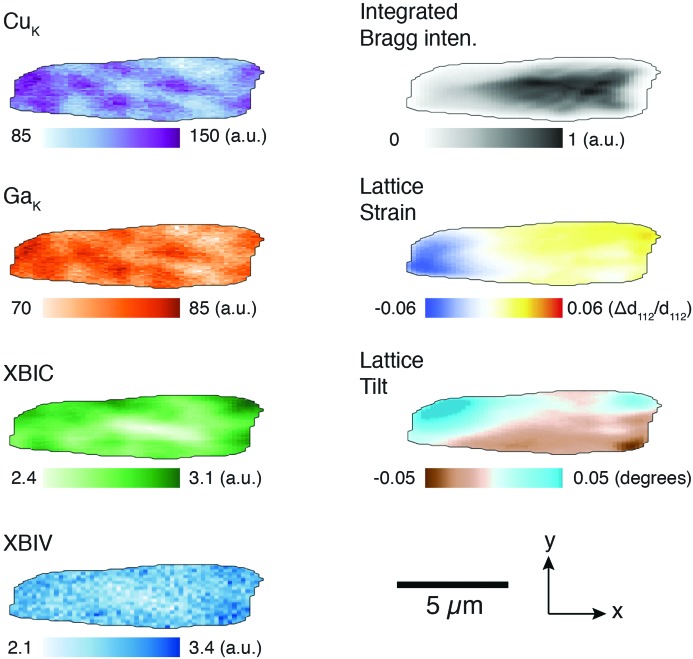
Figure 2.
Scanning nanofocused X-ray beam measurements of one of the five grains in this study are shown. These include elemental maps obtained through analysis of fluorescence spectra (Cu K and Ga K maps), monitoring of local cell performance (XBIC, XBIV), and analysis of the 3D Bragg peak (integrated intensity, lattice strain and lattice tilt) measured at each beam scan position.

