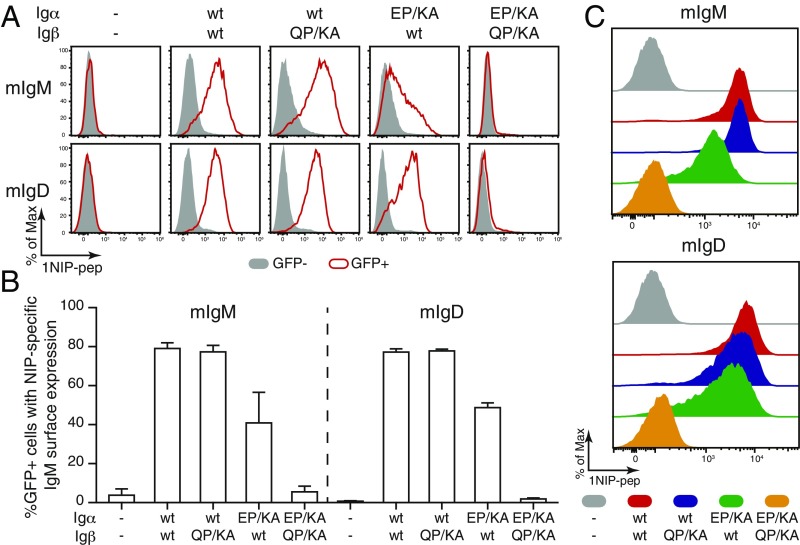
Fig. 4.
Both Igα and Igβ interact with the mIg molecule via the E/Q-X10-P motif. (A) Flow cytometry analysis of the expression of NIP-specific IgM- or IgD-BCR on the surface of S2 cells transfected with plasmids encoding mIgM or mIgD and the indicated wt and mutant forms of Igα and Igβ. Gray: GFP− untransfected cells; Red: GFP+ transfected cells. (B) Quantified BCR surface expression results presented as a bar graph. Data represent the mean and SE of a minimum of 3 independent experiments. (C) Flow cytometry analysis of the expression of NIP-specific IgM- or IgD-BCR on the surface of 3046β-KO cells transfected with plasmids encoding mIgM or mIgD and the indicated wt and mutant forms of Igα and Igβ. Data are representative of 5 independent experiments.

