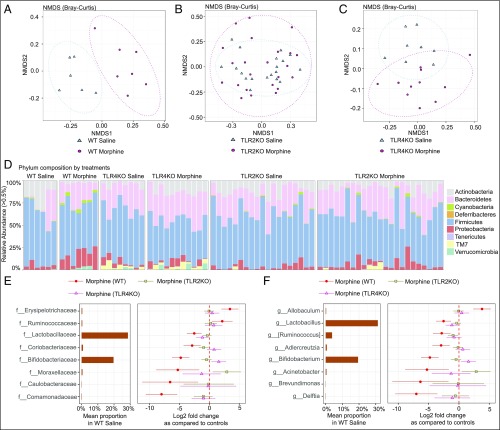
Fig. 5.
Morphine analgesic tolerance induces gut dysbiosis. (A−C) Multidimensional scaling analysis of gut microbiota to visualize the Bray−Curtis distance of WT, TLR2KO, and TLR4KO morphine-tolerant mice and their controls. Red circles depict samples from morphine-tolerant mice; blue triangles represent WT saline-treated mice. β-diversity was found to be significantly different between the WT morphine-tolerant and saline-treated groups (P = 0.00256). (D) Taxonomic distribution of WT, TLR2KO, and TLR4KO morphine-tolerant mice and their controls at phylum level. Each column represents a fecal sample from a treatment group. (E and F) Dot plots show changes in abundance of bacteria with morphine treatment in WT, TLR2KO, and TLR4KO at family and genus level using WT saline mean proportion as reference. Microbial taxa with significant difference in WT mice were selected at false discovery rate < 0.1 and average relative abundance of WT control > 0.1%; nWT = 6 to 7; nTLR2KO = 19 to 24; nTLR4KO = 8 to 11. NMDS, nonmetric multidimensional scaling.

