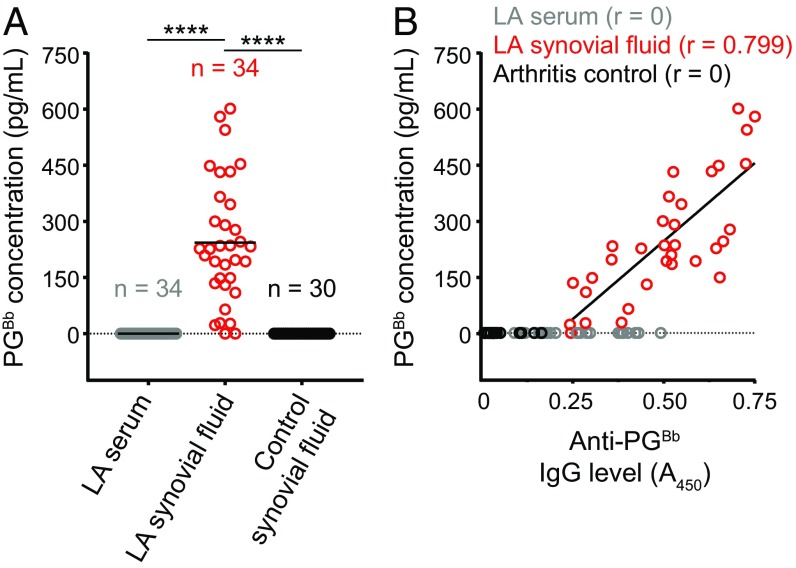
Fig. 3.
Detection of PGBb in synovial fluid samples of patients with LA. (A) Competitive ELISA using rabbit antiserum raised against PGBb to quantify the concentration of PG (in picograms per milliliter) present in each sample. Horizontal black lines indicate means (****P < 0.0001, Kruskal–Wallis test followed by Dunn’s post hoc pairwise test). (B) Plot showing the PGBb concentration of each sample as a function of its anti-PGBb IgG level. The linear fit and the Pearson correlation coefficient (r) for the LA synovial fluid samples are also shown.

