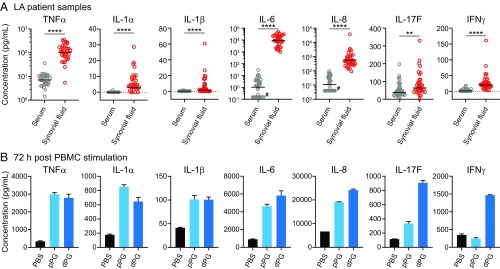
Fig. 4.
Cytokine profile in serum and synovial fluid samples from patients with LA or after in vitro stimulation of human PBMCs with PGBb. (A) Bee-swarm plots showing levels of indicated cytokines in LA patient samples. Horizontal black lines indicate geometric means (****P < 0.0001 and **0.001 < P < 0.01, Mann-Whitney U test). Pound signs indicate samples that yielded no signal but were included for completeness, as zero values cannot be displayed on log-scale axes. (B) Cytokine levels produced by control human PBMCs stimulated by PBS or 100 μg/mL polymeric PG (pPG) or mutanolysin-digested PG (dPG) for 72 h. The 18-h results are shown in SI Appendix, Fig. S7A. All stimulatory studies were performed on pooled, mixed donor samples assayed in duplicate (mean ± SD).

