Figure 2.

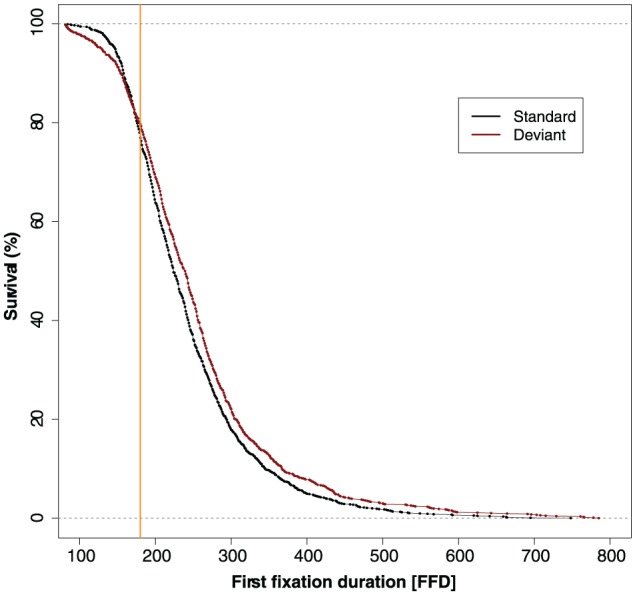
Survival curves of the first fixation during which participants heard the sound. The divergence point (at 180 ms) is shown by the vertical orange line.

Survival curves of the first fixation during which participants heard the sound. The divergence point (at 180 ms) is shown by the vertical orange line.