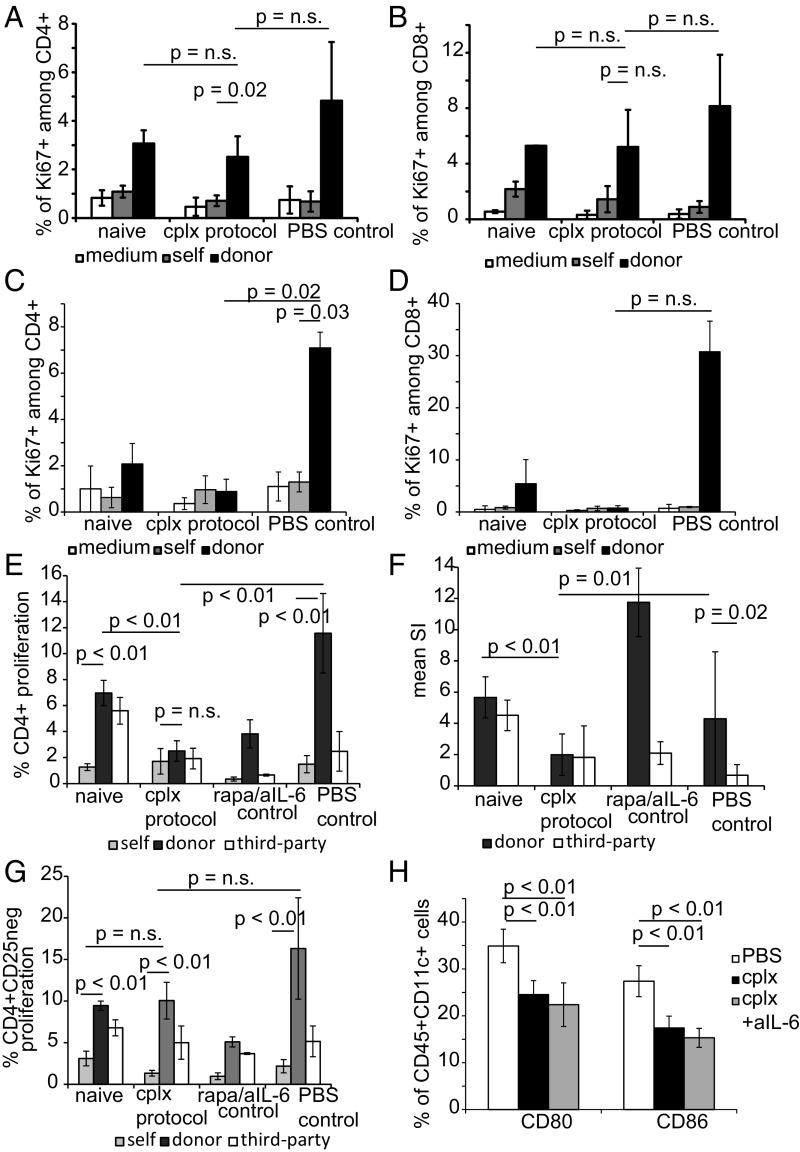
Fig. 5.
IL-2 cplx-based tolerance protocol does not induce systemic (donor) hyporesponsiveness. (A–D) Responsiveness to graft alloantigens was evaluated by in vitro T cell proliferation assays. LN cells were prepared from groups of B6 recipients of BALB/c skin grafts at day 50 (A and B) or day 20 (C and D) after skin transplantation; LN cells from normal B6 mice (naïve) and grafted mice not given IL-2 cplx (PBS control) were used as controls. The 4 × 10⁵ unseparated LN cells were cultured alone (medium) or with 4 × 10⁵ irradiated spleen cells from B6 (self) or BALB/c (donor) mice for 4 d and then assessed for Ki67 expression by flow cytometry. Mean expression of Ki67 expression in CD4 (A and C) and CD8 (B and D) T cells in triplicate cultures is shown (naïve = 2, cplx protocol = 4, PBS control = 3; 2-tailed t test with unequal variances for P values). (E–G) Responsiveness to graft versus third-party alloantigens. LN cells were prepared from B6 recipients of BALB/c skin grafts at day 14 after grafting and starting treatment with IL-2 cplx (cplx protocol) or a mixture of rapamycin and anti–IL-6 mab (rapa/IL-6 control), with untreated grafted mice (PBS control) as a control. LN cells were labeled with VPD and 4 × 10⁵ cells were cultured with 4 × 10⁵ irradiated spleen cells from B6 (self), BALB/c (donor), or C3H (third party) mice for 4d and then assessed for VPD dilution by flow cytometry. Responder cells were either unseparated (E and F) or depleted of CD25+ cells to remove Tregs (G) before culture. (E and G) Mean percentage of CD4 cells that expressed a low density of VPD (indicating proliferation) is shown for triplicate cultures. (F) The mean (SI ratio of responses to BALB/c and C3H relative to responses to B6 stimulators) of unseparated LN cells is shown. Results are pooled from 2 separate experiments and involve cells taken from multiple mice (naïve n = 4, cplx protocol n = 6, rapa/anti–IL-6 n = 2, PBS control n = 5). (H) B7 expression on host DCs. Expression of B7 molecules CD80 and CD86 was measured at day 14 in CD11+ splenocytes of PBS-treated (n = 4), cplx-treated (n = 7), and cplx/anti–IL-6 treated (n = 7) mice (data pooled from 2 independent experiments). Data are shown as mean percentage, error bars depict SD, P values were calculated using a 2-tailed t test with unequal variances.

