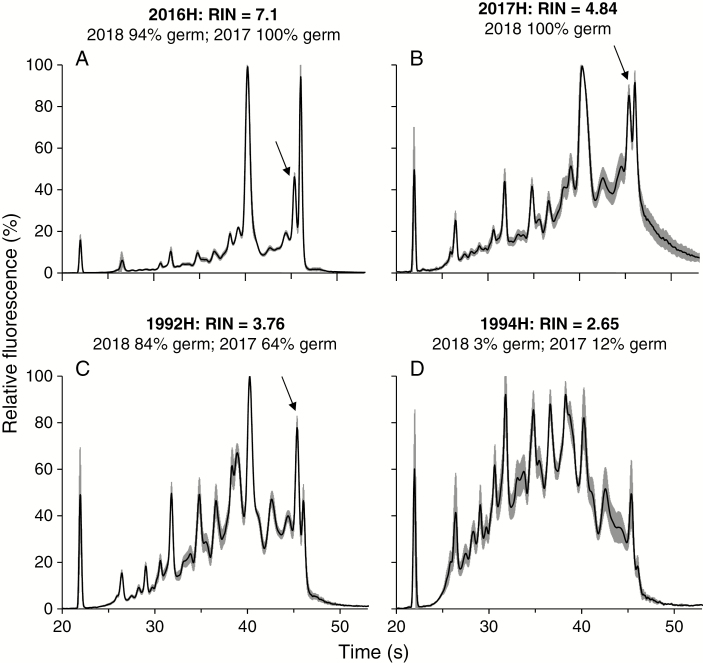
Fig. 3.
Electropherograms of tomato seeds harvested in the indicated years. Data for average fluorescence (black) and standard deviation (grey) are given for five replicates of five seeds each. Electropherograms are ordered from highest (A) to lowest (D) RIN value and show the general trend of decreasing RNA quality with lower germination, though there is considerable variation in calculated RIN and in germination response to storage time. There are two peaks in the region of 25S rRNA (near 45 s) (arrow), which confounded RIN calculation, resulting in low RIN values despite highly viable material [e.g. 2017H seeds (B)].

