Fig. 4.
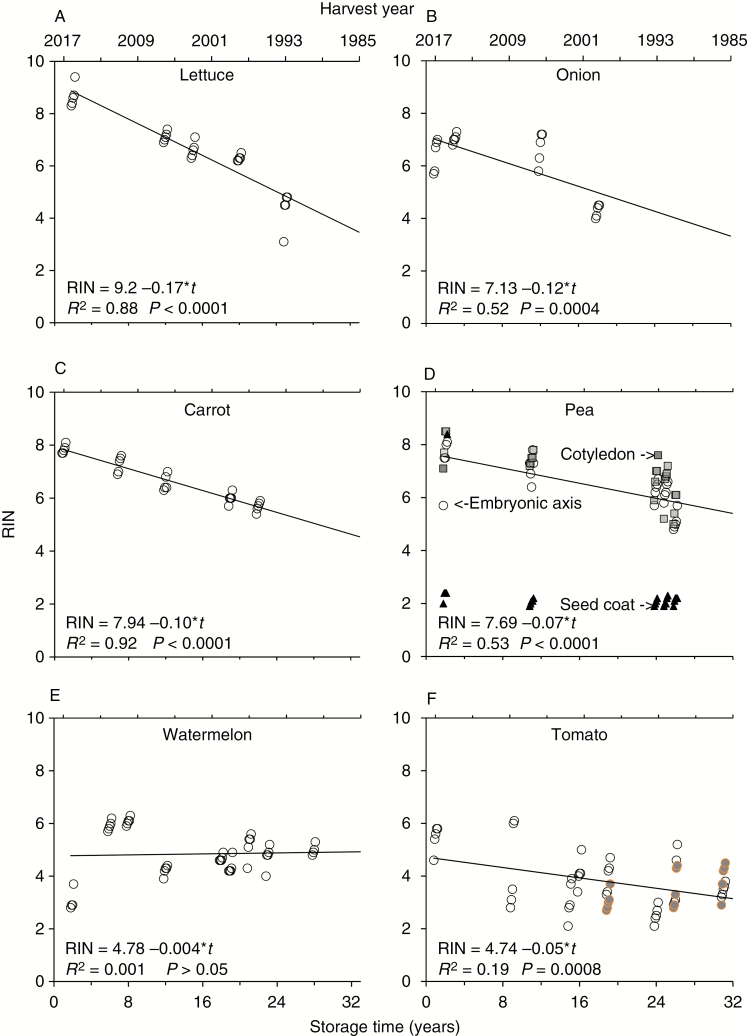
RNA integrity of stored seeds as a function of storage time. Specific cohorts from a larger collection (Fig. 1, circled points) were selected for RIN analysis to provide a range of germination proportions and storage times. RIN values are provided for each of five replicates and data points are jittered as an aid to the eye. The drawn lines represent a linear model of the correlation between time and RIN, and the results of the regression are provided for each species. Sample size for each regression (N) is the number of time points × 5. Each pea seed was separated into embryonic axis (circles), cotyledon (squares) and seed coat (triangles) before RIN assessment (D); regression results are for embryonic axes. Data from the three trichomeless tomato seed cohorts (coloured points) were included in the regression (F). There is a significant negative linear correlation between RIN and storage time (t) for all species except watermelon (E).

