Figure 2.
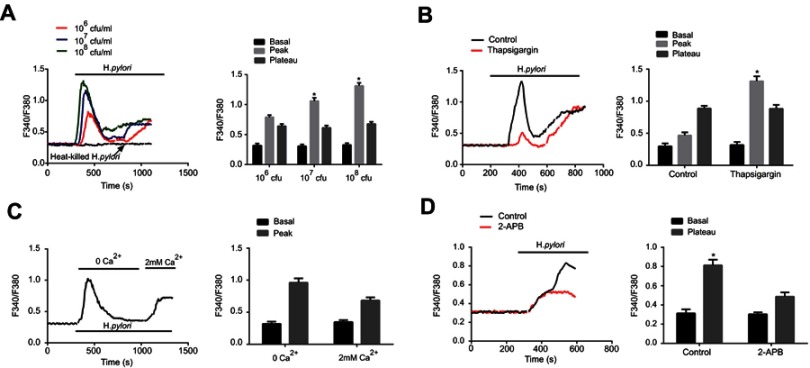
H. pylori induces intracellular Ca2+ increase through intracellular Ca2+ release and extracellular Ca2+ influx. (A) Representative tracings of intracellular Ca2+ concentration ([Ca2+]i) changes with varying concentrations [1×10⁶–1×10⁸ colony-forming units (CFU)/mL] of H. pylori on Fura 2-loaded gastric cancer cells. The addition of H. pylori produced a concentration-dependent biphasic change in [Ca2+]i, which was followed by a return to baseline [Ca2+]i levels. Histogram at the right shows the summary data for peak and plateau changes of Fura-2 fluorescence ratio. Heat killed H. pylori was used as a negative control. *P<0.05. (B) Effects of intracellular Ca2+ depletion on H. pylori-induced [Ca2+]i changes in MKN45 cells. Fura 2-loaded human gastric cancer cells were pretreated for 30 mins with 500 nM thapsigargin to release intracellular Ca2+. The H. pylori strains (1×10⁸ CFU/mL) were then added, the peak and plateau changes were recorded. Histogram at the right shows the summary data for peak and plateau changes of Fura-2 fluorescence ratio. *P<0.05. (C) Effects of extracellular Ca2+-free Ringer on H. pylori-induced [Ca2+]i changes in gastric cancer cells. Fura 2-loaded cells were first exposed to extracellular Ca2+-free Ringer for 15 mins, H. pylori strains (1×10⁸ CFU/mL) were added and [Ca2+]i was recorded. Then, 2 mM Ca2+ was readded to the solution and [Ca2+]i was recorded again. Right panel: Summary data for peak changes of Fura-2 fluorescence ratio. (D) Effects of 2-APB on H. pylori-induced [Ca2+]i changes gastric cancer cells. Fura 2-loaded human gastric cancer cells were pretreated for 30 mins with 500 nM thapsigargin for depletion of intracellular Ca2+. Then, time course of [Ca2+]i changes induced by H. pylori in the absence and presence of 100 nM 2-APB was recorded. Histogram at the right shows the summary data for basal and plateau changes of Fura-2 fluorescence ratio. *P<0.05. For all tracings, n=10 independent experiments.

