
Figure 3. Local Gradients of pO2.
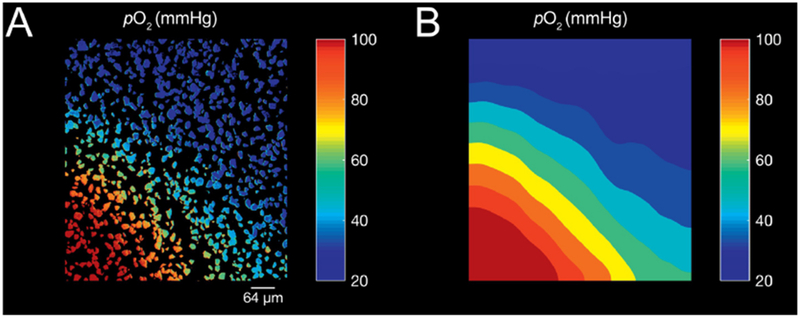
A, Calibrated pO2 as reported by a dense layer of OxySplots B, Interpolated heat-map of pO2 gradient. Bulk, bath perfusion using O2 depleted solution with micro-perfusion manifold emitting O2 rich solution positioned in the bottom left of field of view.