
Figure 5. Mitochondrial inner membrane potential in single cardiac cells during changes of pericellular pO2.
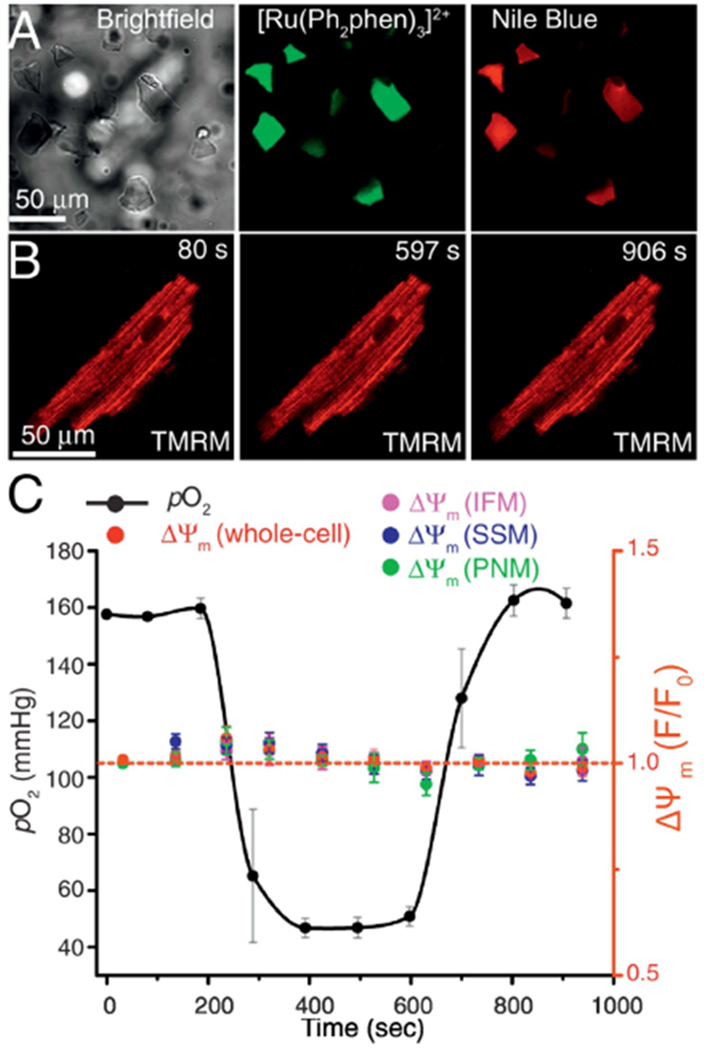
A, Left, bright-field image (112×112 μm) showing OxySplots. Also visible is the shadow of a cardiomyocyte adherent to the top of the PDMS layer 36 μm above the shown imaging plane. Middle, confocal image showing the fluorescence of [Ru(Ph2phen)3]2+. Right, confocal image showing the fluorescence of Nile blue. B, Confocal images of a TMRM loaded cardiomyocyte captured at the indicated time points during the experiments shown in panel C. C, The time course of changes in pO2 (black) and of TMRM fluorescent signals from the whole-cell (red), from intermyofibrillar mitochondria (IFM), from subsarcolemmal mitochondria (SSM), and from perinuclear mitochondria (PNM).