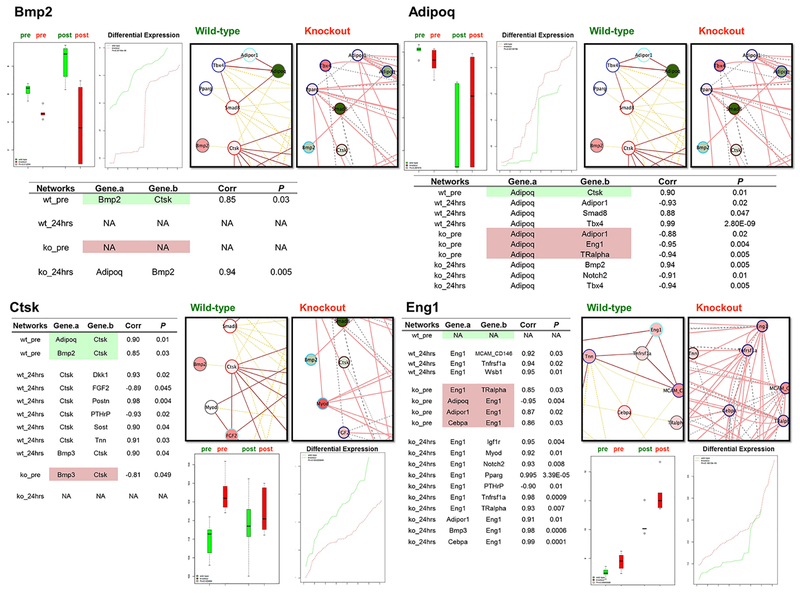
Figure 3. Streamline Presentations of Differentially Co-Expressed Genes (Bmp2, Adipoq, Ctsk, and Eng1).
Expression levels were plotted in bar charts. Green boxes: WT group; red boxes, knockout group. The network illustration is similar as in Figure 2 (pre-fracture and post-fracture merged) with smaller snapshots of the gene of interest and the connected genes. Node coloring indicates gene activities after fracture – red, induced; green, suppressed; Node border: topological gene grouping; edge coloring: experimental groups. See Figure 2 “inset”. Table of co-expression gene activities in each experimental condition is provided (please see Fig. S7–S32 for the complete list of the 26 DEGs).

