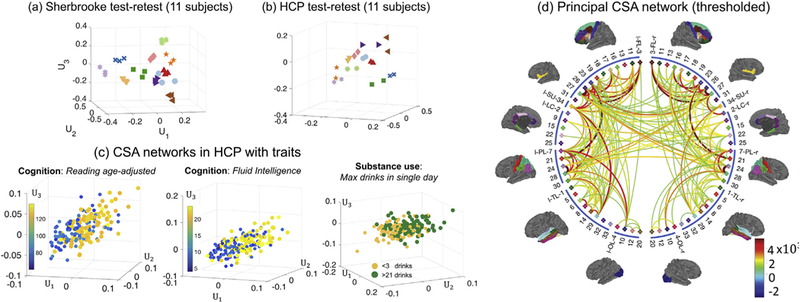
Fig. 4.

Illustration of connectome visualization using TN-PCA. In (a) and (b), we display brain PC scores for CSA networks from the HCP and Sherbrooke test-retest data sets. Each unique marker represents multiple scans from the same subject (3 scans per subject in Sherbrooke and 2 scans per subject in HCP). In (c), we show PC scores with traits. For each cognition trait, we selected 100 subjects with low trait scores and 100 subjects with high scores. For the substance use trait (alcohol use), we selected subjects with <3 drinks and subjects with > 21 drinks. In (d), we display the principal CSA brain network calculated using all 1065 subjects from the HCP data set. For display purposes, we thresholded the dense principal brain network to keep only the 200 most connected edges.
