Fig. 5.

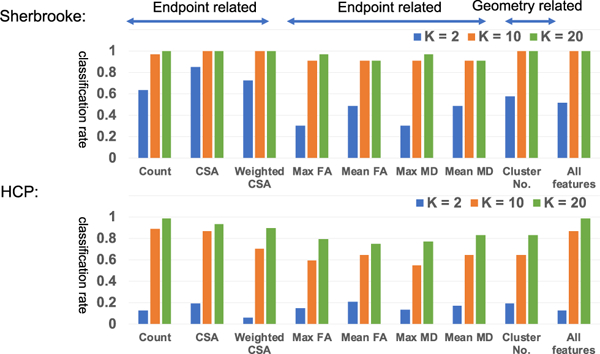
Classification results on the Sherbrooke and HCP test-retest data sets. The results are based on nearest neighbor classification. “K” here indicates the number of component in TN-PCA.

Classification results on the Sherbrooke and HCP test-retest data sets. The results are based on nearest neighbor classification. “K” here indicates the number of component in TN-PCA.