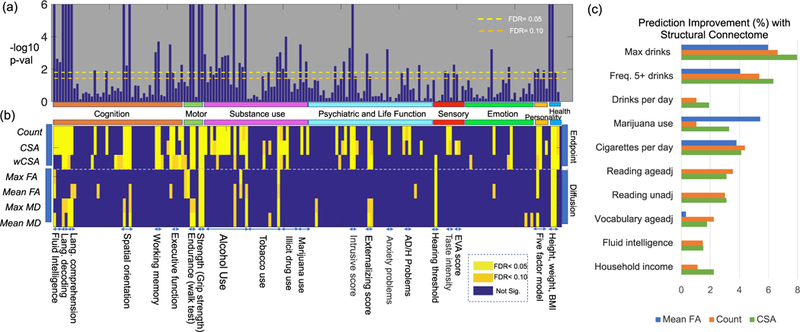
Fig. 6.

Relation between structural brain connectomes and various traits. Panels (a) and (b) show hypothesis testing results for 175 traits and 7 different weighted networks. In (a), we show p-values (−log10 scale) of the CSA weighted networks with different traits. Two different FDR thresholds are used (different colored dash lines). In (b), we present hypothesis testing results for different combinations of traits and networks. Each row shows a type of weighted network and each column shows a particular trait. The significance is displayed based on different FDR values. Panel (c) shows the top 10 traits in terms of their predictability based on brain connectomes adjusting for age and gender as covariates. The prediction improvement ratio ρp for the pth trait is shown.
