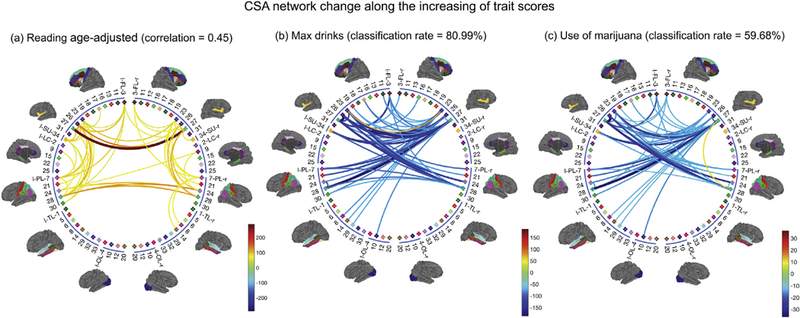
Fig. 8.

Top 50 pairs of brain regions in terms of their changes in CSA connectivity with increasing traits. (a) Results for increasing language reading score; (b) Results for max drinks; (c) Results for marijuana use. We also display the correlation and binary classification rates obtained from CCA and LDA, providing measures of differences in brain connectivity networks between subjects with different trait scores.
