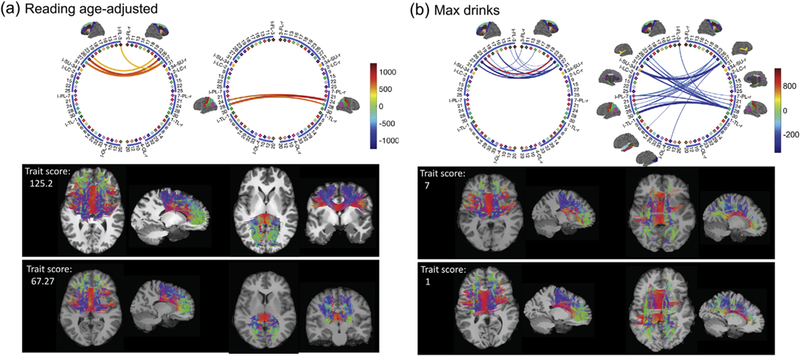
Fig. 9.

Network difference (based on CSA network) and the corresponding streamlines for selected subjects in the HCP data set. Among the 50 pairs of brain regions identified in Fig. 8, we focus on cross-hemisphere connections. Such connections are either between (lFL, rFL) or (lPL, rPL). In (a) we show the differences between subjects with high (125.2) and low (67.27) reading scores. The streamlines corresponding to these connections are shown in the second row. Similar results are plotted in (b) for two selected subjects with light and binge drinking.
