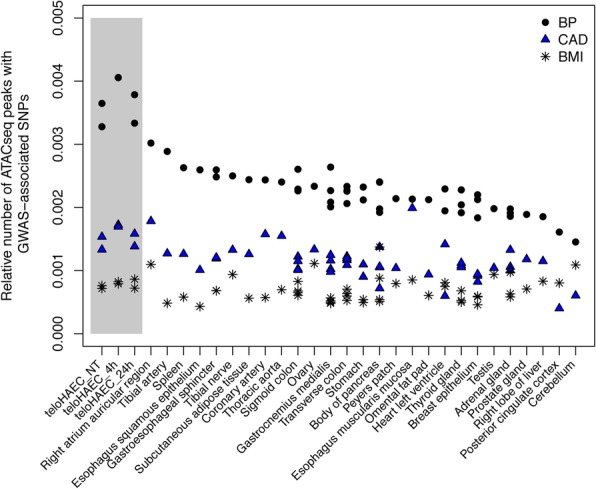
Fig. 2.

Enrichment of blood pressure (BP) and coronary artery disease (CAD)-associated SNPs in open chromatin regions. We compared overlap in endothelial cells (teloHAEC) and all available tissues from ENCODE. Each biological replicate is identified by a different point. We called all ATACseq peaks with the same bioinformatic pipeline. To account for the different coverage of each ATACseq library, we present the relative fraction of ATACseq peak that overlap with a BP or CAD SNP. We used body mass index (BMI)-associated SNPs as controls, since BMI is not a vascular phenotype. The gray box highlights results generated in this study in non-treated (NT) or TNFα-stimulated (4 or 24 h) teloHAEC
