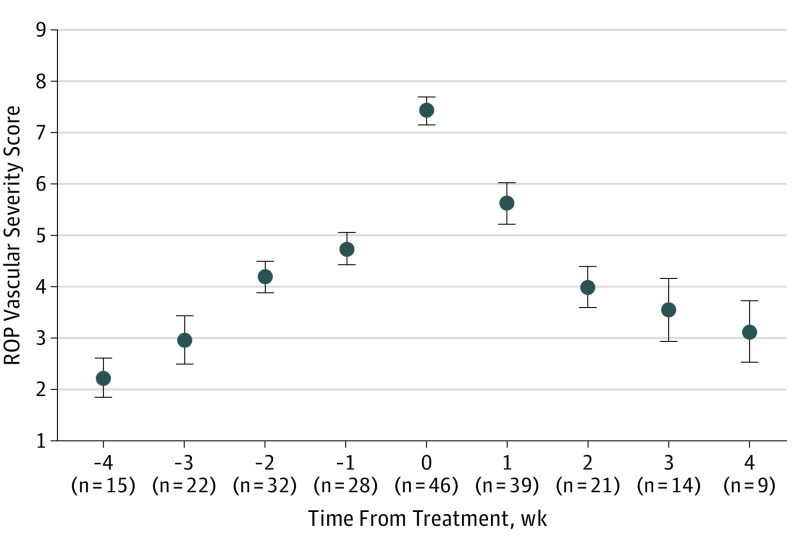
Figure 3. Quantitative Retinopathy of Prematurity (ROP) Vascular Severity Score Progression and Regression in a Cohort of Infants Who Developed Treatment-Requiring Disease.
Mean scores are displayed relative to time of treatment (which is time 0). Number of clinical examinations (n) evaluated at each time is displayed. Error bars indicate 95% CIs.

