
Figure 2.
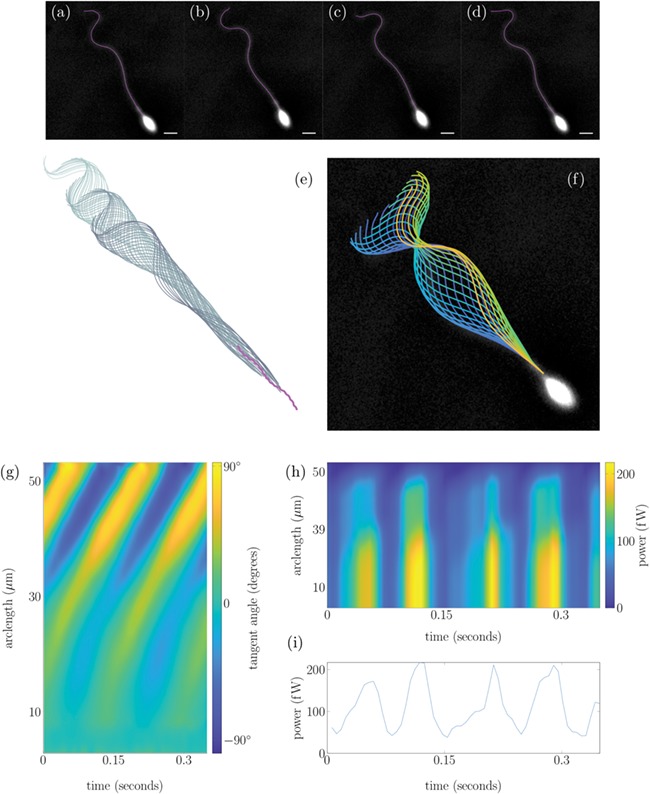
Tracking of a human sperm from experimental data set (1) in the HVM. Panels (a)–(d) show an overlay of the tracked flagellum over experimental frames at four points in a beat cycle, with a 5 μm white scale bar. Panel (e) shows the sperm head track in magenta with associated flagellum plotted 0.007 s apart. Panel (f) plots the flagellar beat over a single experimental frame with the colour of each flagellum representing time from dark blue to yellow. Panel (g) plots the tangent angle along the flagellum in the cell frame for 0.35 s. Panel (h) shows the power exerted by the flagellum on the fluid distal to the point in arclength chosen, with the power exerted by the full flagellum shown in panel (i).