
Figure 3.
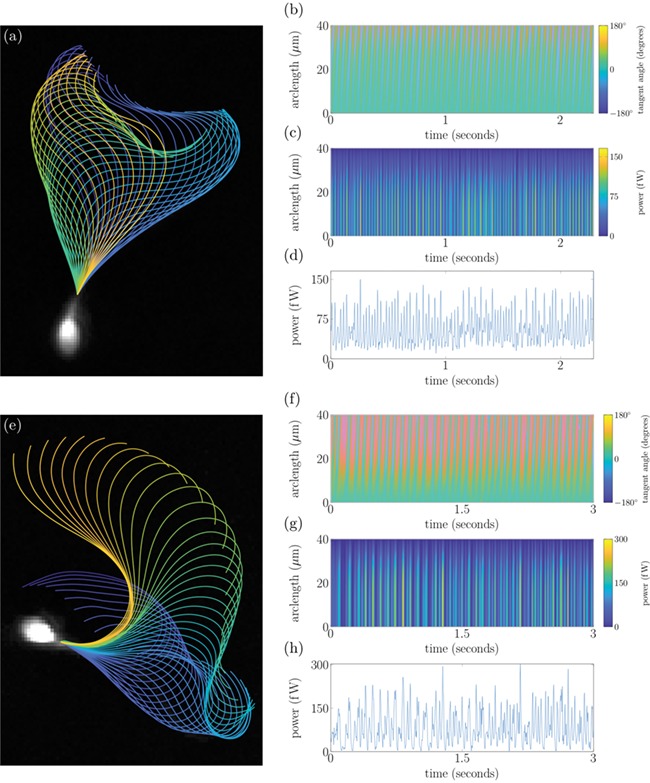
Tracking of stuck sperm from experimental data set (2) enabling long-time analysis of cells. Panels (a)–(d) show the flagellar beat, tangent angle, power exerted by the flagellum distal to a point in arclength and total power exerted by the flagellum, respectively. Panels (e)–(h) show the same plots for a hyperactivated cell after stimulation with 4AP.