
Figure 4.
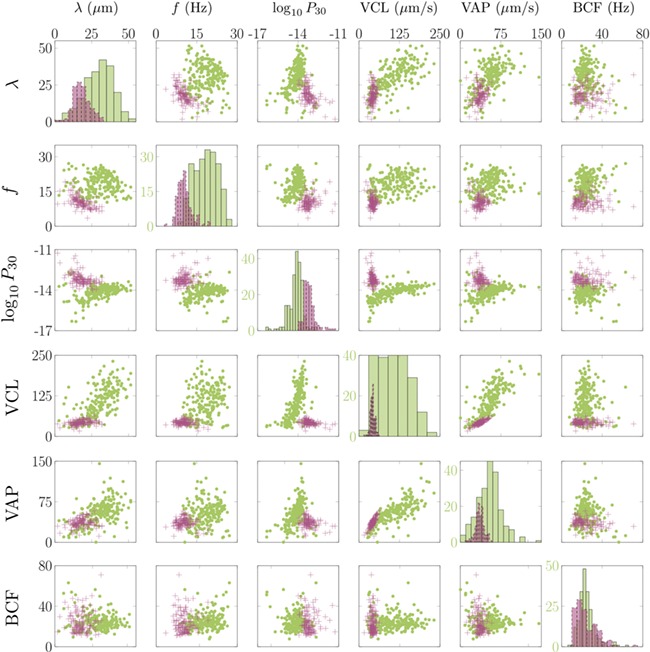
Scatter plot matrix. Scatter plot matrix showing relationships between arc-wavelength λ, flagellar beat frequency f, power generated by the first 30 μm of flagellum P30 (measured in watts and plotted on a log scale), the curvilinear velocity of the head (VCL), the average path velocity of the head (VAP) and the beat cross frequency of the head (BCF). Axes persist from left to right and top to bottom except on the leading diagonal where frequencies are shown in green. In each plot, sperm swimming through HVM are shown as magenta crosses and sperm swimming through DSM are shown as green dots.