
Figure 5.
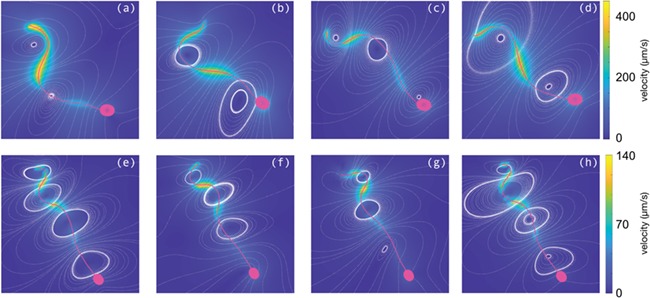
Simulated velocity fields with NEAREST for the tracked sperm in Figs 1 and 2. The FAST tracked flagellum for each sperm has been paired with an idealized head and simulated in a three-dimensional environment. Panels (a)–(d) show the flow fields in DSM at times corresponding to Fig. 1a–d, while (e)–(h) are in HVM, corresponding to Fig. 2a–d. In each figure the colour depicts the fluid velocity magnitude, with the sperm cell overlain in magenta and streamlines shown as white dots.