
Figure 6.
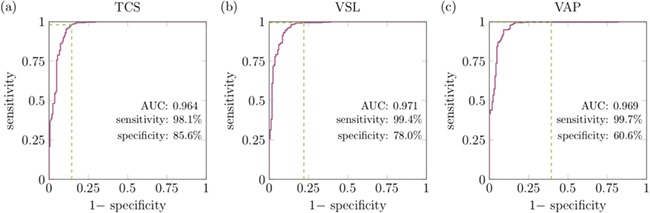
ROC curves for characterizing sperm as progressive compared to the gold standard manual classification by a trained analyst. In panel (a) the ROC curve using TCS is plotted, with the more standard use of VSL and VAP shown for comparison in panels (b) and (c). The green lines highlight the sensitivity and specificity when using the 5 μm/s WHO categorization (WHO, 1999).