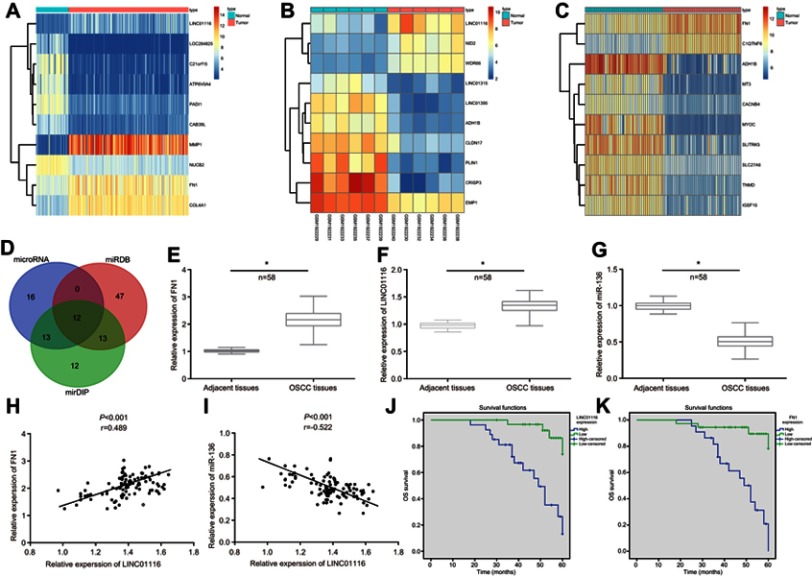
Figure 1.
LINC01116 and FN1 are highly expressed while miR-136 is repressed in OSCC and related to poor prognosis. (A) The heat map of the microarray data GSE30784. (B) The heat map of the microarray data GSE74530. (C) The heat map of the microarray data GSE37991. The abscissa referred to the sample number, and the ordinate referred to names of differentially expressed genes. The upper right histogram represented the color gradation, the color changing from top to bottom indicated the expression value in the microarray data from high to low, each rectangle corresponded to the expression of one sample, each column showed the expression of all genes in each sample, and the left dendrogram revealed the cluster analysis results of the different genes in different samples, the uppermost bar indicated the sample type, and the upper right block indicated the sample color reference. (D) The microRNA.org website, miRDB website, and mirDIP website were used to predict the intersection of the miRNA of FN1. (E) RT-qPCR was used to determine the expression of LINC01116 in 58 cases of OSCC tissues and adjacent tissues (*p<0.05 vs adjacent tissues). (F) RT-qPCR was used to determine the expression of FN1 in 58 cases of OSCC tissues and adjacent tissues (*p<0.05 vs adjacent tissues). (G) RT-qPCR was used to determine the expression of miR-136 in 58 cases of OSCC tissues and adjacent tissues (*p<0.05 vs adjacent tissues). (H) The correlation analysis between the expression of LINC01116 and FN1 in OSCC tissues demonstrated a positive correlation. (I) The correlation analysis between the expression of LINC01116 and miR-136 in OSCC tissues demonstrated a negative correlation. (J) The survival analysis related to LINC01116 expression in patients with OSCC indicated that higher expression of LINC01116 was associated with poor prognosis. (K) The survival analysis related to FN1 expression in patients with OSCC indicated that higher expression of FN1 was associated with poor prognosis. n=58; the data were measurement data and expressed as mean±standard deviation. The t-test was used for comparison between two groups. *p<0.05 vs adjacent tissues.
Abbreviations: FN1, fibronectin1; miR-136, microRNA-136; OSCC, oral squamous cell carcinoma; RT-qPCR, reverse transcription quantitative polymerase chain reaction.

