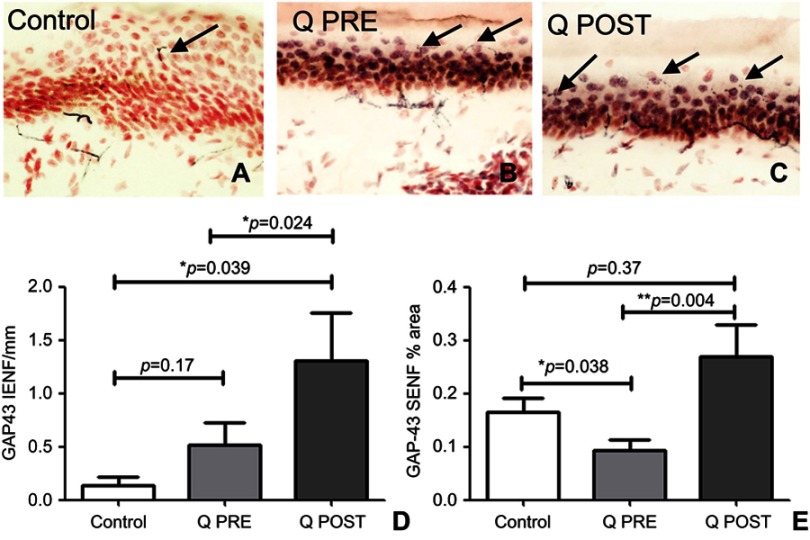
Figure 5.
Immunohistochemistry in skin biopsies for GAP43, before and after capsaicin 8% patch treatment. Representative image of intra-epidermal nerve fibers (arrowed) and sub-epidermal nerve fibers from (A) control subjects, at the baseline visit (B, Q PRE) and, after capsaicin 8% patch treatment (C, Q POST), magnification x40. (D) Bar chart of intra-epidermal nerve fibers for GAP43 (IENF) counts; (E) bar charts of sub-epidermal (SENF) analysis (% area) for GAP43.
Notes: *Significant; **very significant.

