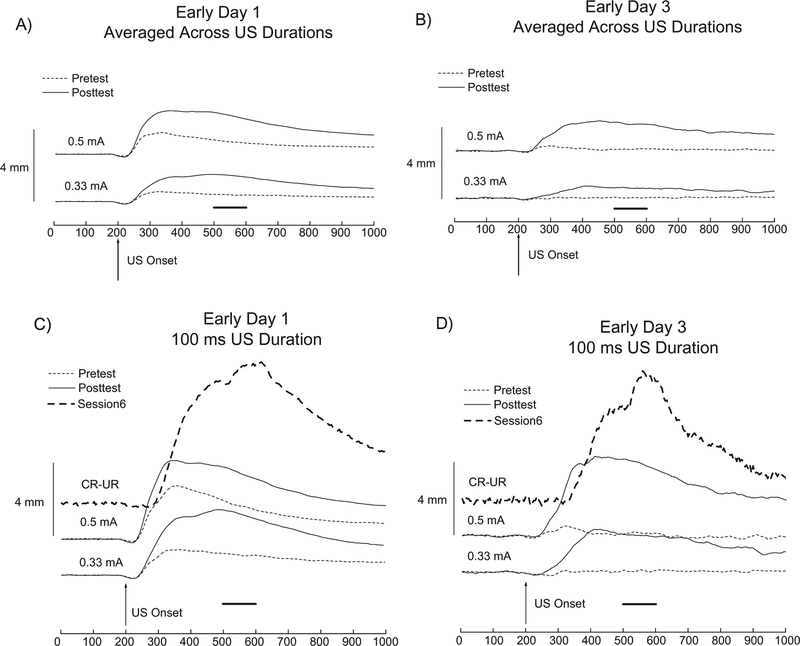
Fig. 6.
Pretest (dotted line) vs Posttest (solid line) averaged group topographies of the unconditioned nictitating membrane response (NMR) averaged across four electrodermal unconditioned stimulus (US) durations for the Early Day 1 Group (n = 36) that rapidly conditioned (Panel A) and for the Early Day 3 Group (n = 3) that required two additional sessions to reach the 8/10 conditioned response (CR) criterion (Panel B). The top pair of traces of Panels A and B correspond to unconditioned responses (URs) averaged across four US durations (10, 25, 50 and 100 ms) at 0.5-mA during Pretest (dotted line) and Posttest (solid line) while the bottom pair of traces correspond to URs averaged across the same four durations at 0.33-mA during Pretest (dotted line) and Posttest (solid line). Data is similarly presented for the bottom two traces in Panels C and D, except that only the 100 ms US duration is shown. The top traces (dashed lines) of Panels C and D correspond to the averaged group CR-UR topography on Trial 1 of Session 6 of NMR conditioning. The Pretest was presented prior to and the Posttest was presented following six daily sessions of NMR conditioning. During Pretest and Posttest, the US was presented 200 ms after the start of the NMR trace recording (vertical arrows). Note the horizontal lines in the four panels correspond to the timing of the US presentation during NMR conditioning.

