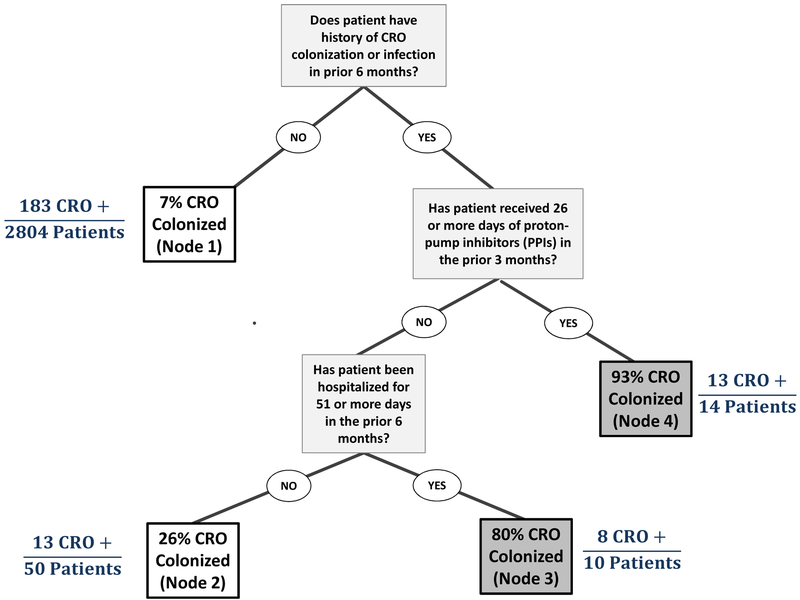
Figure 3.
Decision tree for predicting CRO perirectal colonization at hospital unit admission. Gray-shaded terminal nodes indicate that the tree would classify patients as CRO-colonized, and accompanying percentages reflect the probability that patients assigned to a given terminal node are CRO-positive. Terminal node numbering, 1 through 4, is included in parentheses. The tree had an area-under-the-curve (C-Statistic) of 0.57, which was unchanged in cross-validation. Its sensitivity and specificity were 9.8% and 99.9%, respectively, and its positive and negative predictive values were 87.5% and 93.1%, respectively.

