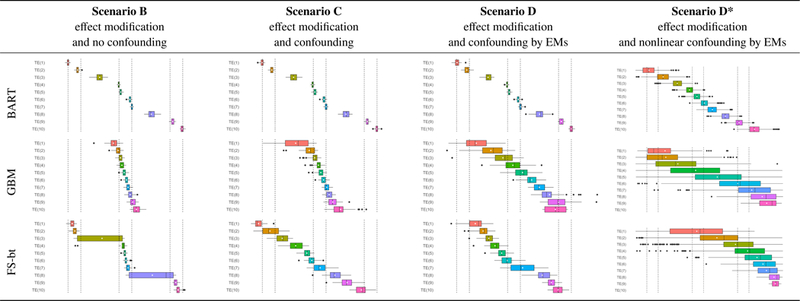
FIGURE 2.

Box plots of point estimates of the ATE across 1000 replicates of each simulation scenario, with layout analogous to that of Figure 1 in the main text. For clarity, the x-axes of the plots have been omitted, but there are vertical dashed lines denoting the true average treatment effects (1,2,5,6,9,10). Summary results for Simulation Scenario A can be found in Appendix 3.1 of the Supplementary Materials.
