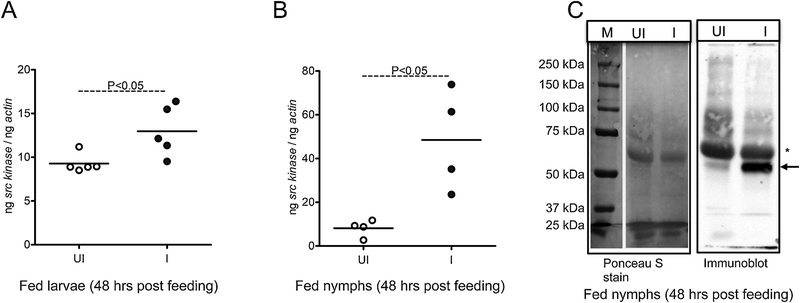
Figure 4. Src tyrosine kinase is upregulated in post-fed A. phagocytophilum-infected I. scapularis ticks.
Expression of src kinase in ticks upon A. phagocytophilum acquisition (48 h post repletion) is shown from uninfected (UI) and infected (I) post-fed nymphs (A) or larvae (B). In panel A each circle indicates one individual tick. In panel B, each circle represents data obtained from 5–7 pooled ticks. The mRNA levels of src are normalized to tick beta-actin mRNA levels. Open circle represents uninfected (UI) and closed circles represent infected (I) ticks in (A) and (B). P value from non-paired Student’s t-test is shown. C) Immunoblotting analysis showing expression of potential Src kinase in fed uninfected (UI) or A. phagocytophilum-infected (I) nymphs analyzed after 48 h post-feeding. Arrow to the right indicates prominent intensity band at approximately 50 kDa (potential phosphorylated Src protein band). The Ponceau S stained image serve as control. Asterisk indicates possible host IgG heavy chain. M indicates marker, and sizes are shown in kDa.

