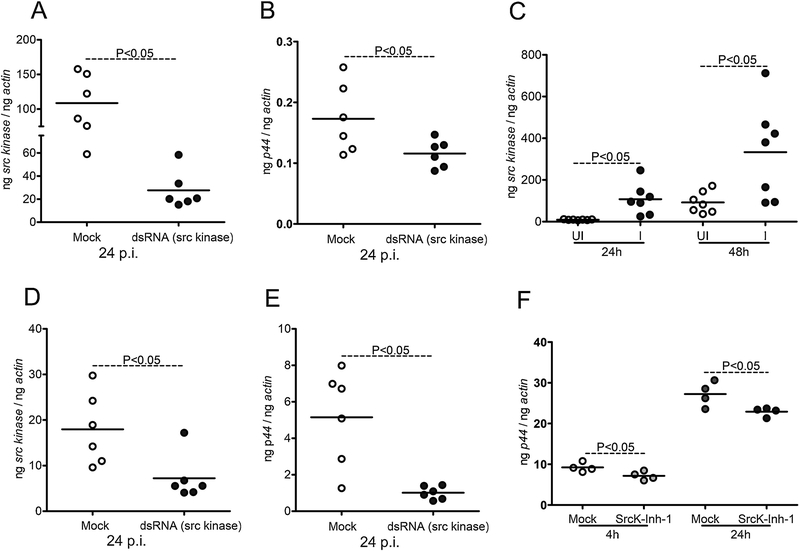
Figure 6: RNAi-mediated silencing of src in ticks and tick cells affects A. phagocytophilum growth and survival.
A) QRT-PCR analysis showing silencing efficiency of src expression (A) or bacterial burden (B) upon A. phagocytophilum infection in 48 h post-fed mock or src-dsRNA treated ticks. In panel A and B, Open circle represents A. phagocytophilum-infected mock-treated and closed circles represent infected src-dsRNA treated ticks. Each circle represents one tick. C) Levels of src transcripts in tick cells upon A. phagocytophilum infection at 24 and 48 h p.i. is shown. Open circle represents uninfected (UI) and closed circles represent infected (I) tick cells. QRT-PCR analysis showing reduced src transcript levels (D) or bacterial burden (E) upon treatment with mock or src-dsRNA in A. phagocytophilum-infected tick cells is shown. F) A. phagocytophilum burden in mock (DMSO) or 5 μM of Src inhibitor-treated tick cells at 4 or 24 h post infection is shown. The data shown in D-F is from A. phagocytophilum-infected ISE6 tick cells -treated with mock or src-dsRNA or inhibitor. Open circle represents A. phagocytophilum-infected mock treated and closed circles represent infected-src-dsRNA or inhibitor treated tick cells in panels D-F. Each circle represents data from one independent culture plate well. The mRNA levels of src and P44 DNA levels are normalized to tick beta-actin levels. P value from non-paired Student’s t-test is shown.

