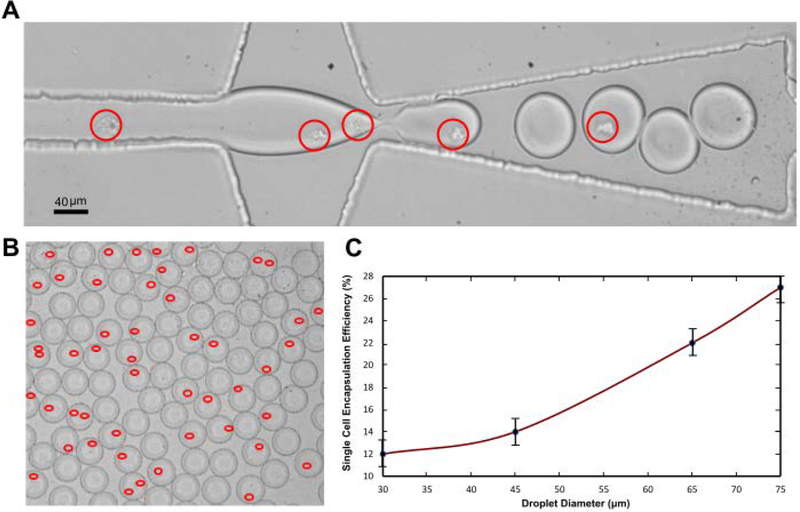
Figure 2:
(A) Demonstration of the single cell encapsulation process. The red circle indicates the presence of one cell. (B) Droplets collected after the encapsulation process. The presence of cells is highlighted in red. (C) Graphic illustrating the encapsulation efficiency of k-562 cells in droplets. Efficiency increases with the droplet diameter and peaks at an optimum diameter. However, it is observed that the efficiency decreases beyond a threshold diameter due to multiple encapsulations (doublets/triplets) (not shown).

