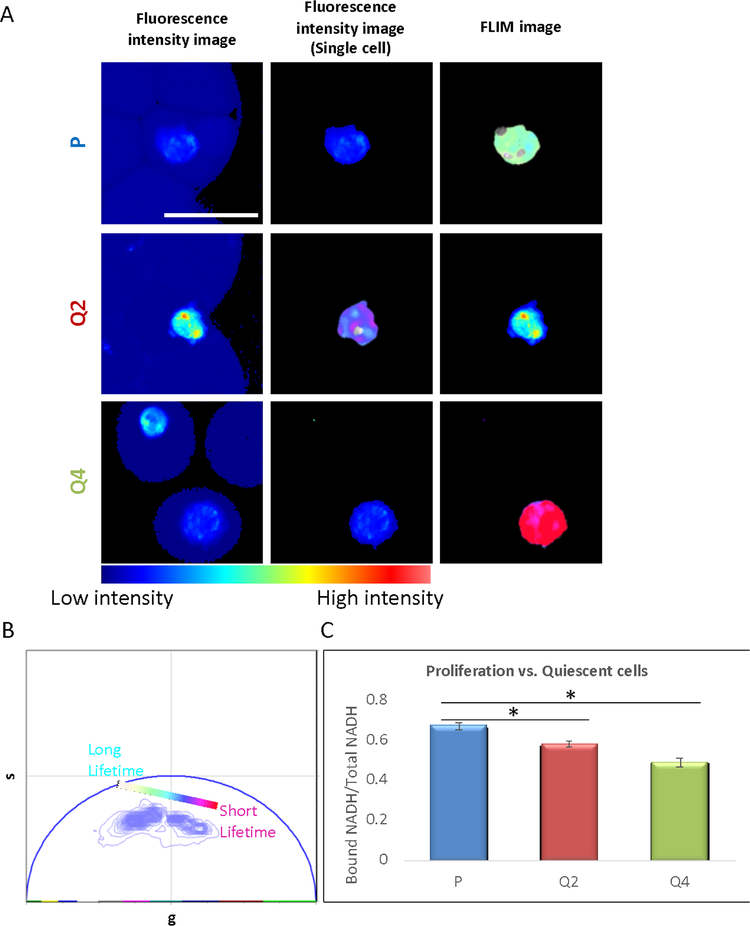
Figure 5.
A) Fluorescence intensity images of the single cell within droplets, and FLIM images of the human foreskin fibroblast under regular proliferation condition(P), serum starved for 2 days(Q2), and serum starved for 4 days(Q4). The FLIM images were pseudocolored by the color bar in Fig. 5B, scale bar: 50 μm. B) Phasor plot shows the FLIM signature distribution of the P, Q2 and Q4 conditions. From Cyan to Pink, the color shows the signature move from the long lifetime (higher Bound/Free NAD(P)H) to the short lifetime (lower Bound/Free NAD(P)H). C) Bar graph shows the bound NAD(P)H/Total NAD(P)H ratio of the P, Q2 and Q4 conditions. The Q2 and Q4 group shows significant decreasing of Bound NAD(P)H, p-value for P and Q2 groups is 0.001, p-value for P and Q4 group is 0.002 (P group, n=21, Q2 group, n=4, Q4 group, n=19).

