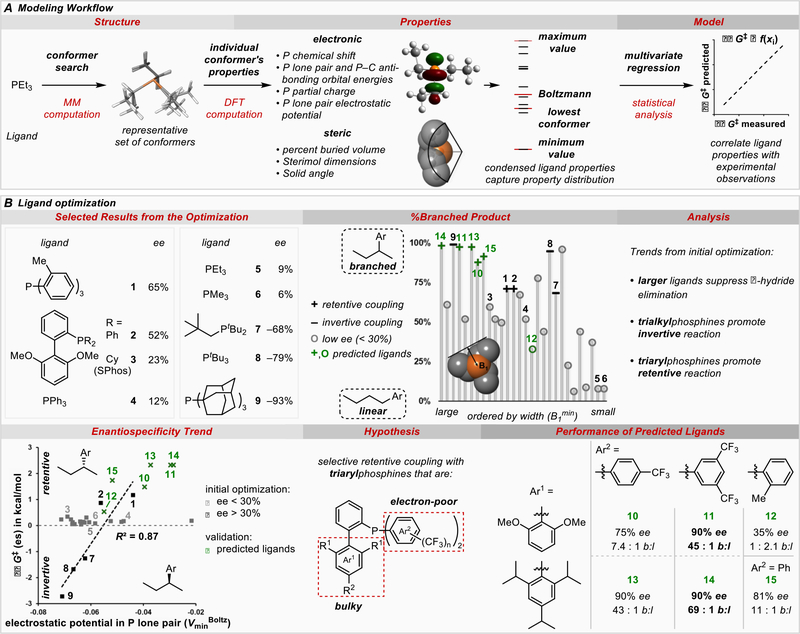
Figure 2.
Phosphine parameterization. A) Workflow of parameter generation and statistical modeling. B) Application of phosphine parameterization to ligand optimization of the reaction shown in Figure 1C with Z = CO2Et. b:l = branched to linear ratio. +% ee = net retention, −% ee = net inversion.

