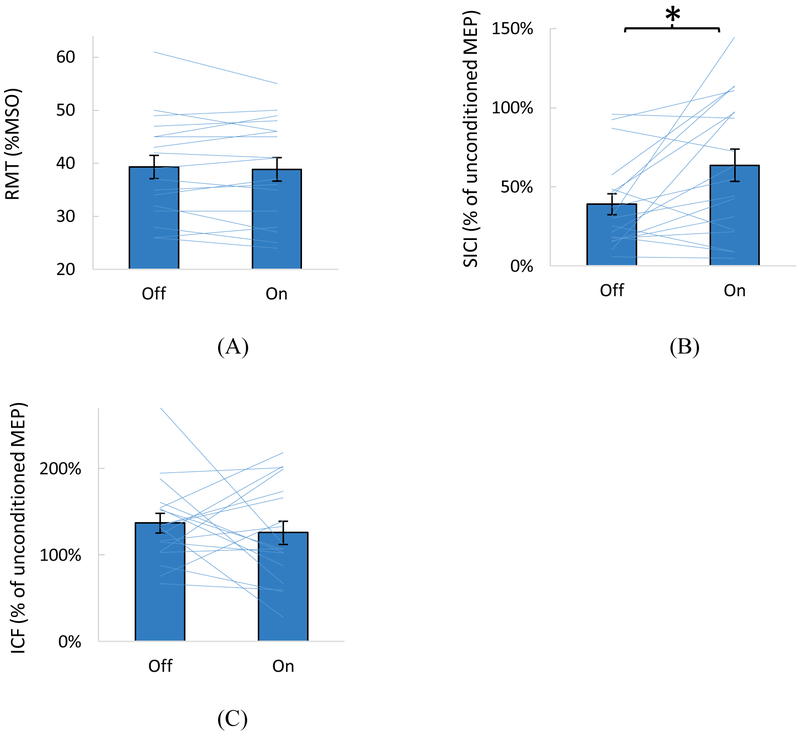
Figure 2.
Comparison between the vibration on and off conditions for the resting motor threshold (RMT) (A), short-interval intracortical inhibition (SICI) (B), and intracortical facilitation (ICF) (C). Means with SE are shown as bar graphs with error bars. Individual subjects’ data are shown as lines. (B) and (C) show conditioned MEP amplitudes expressed as % of the unconditioned MEP amplitudes. Increase in values in (B) indicates reduced inhibition. A significant difference between the vibration on and off conditions was found for SICI only (noted with * in B).

