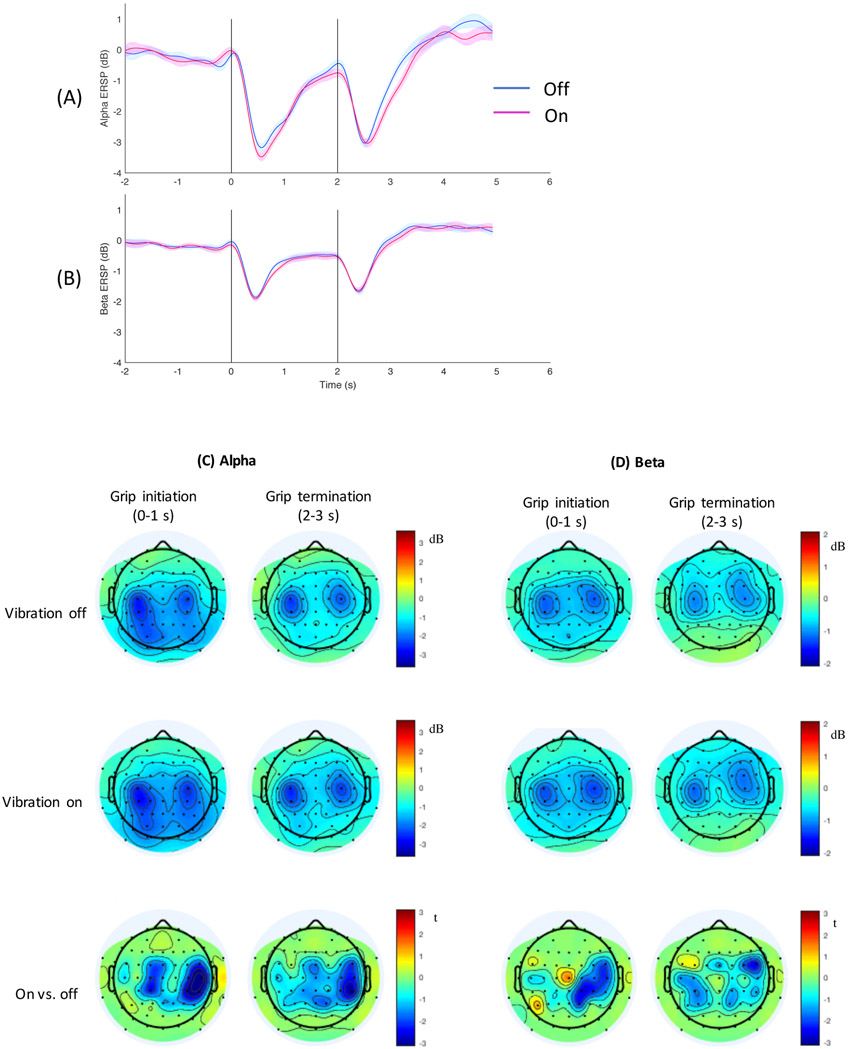
Figure 4.
The time course of event-related spectral perturbation (ERSP) is shown for the alpha (A) and beta band (B) for the two vibration conditions, with shades showing the standard error for each vibration condition. ERSP is expressed as change from the baseline power in dB. The vertical lines represent the times the grip cue was presented to the subject at 0 s and the rest cue at 2 s. ERSP time course averaged for three electrodes (FC4/C4/CP4) is shown. Topography of event-related desynchronization (ERD) is shown for the alpha (C) and beta band (D). In C & D, the first column shows the topography for grip initiation (averaged over 1 s period immediately after the cue to grip), and the second column shows the topography for grip termination (averaged over 1 s period immediately after the cue to rest). The first row shows ERD topography for the vibration off condition, the second row for the vibration on condition, and the third row for t-statistics comparing the vibration on vs. off conditions with the blue color indicating greater ERD with vibration compared to without.

