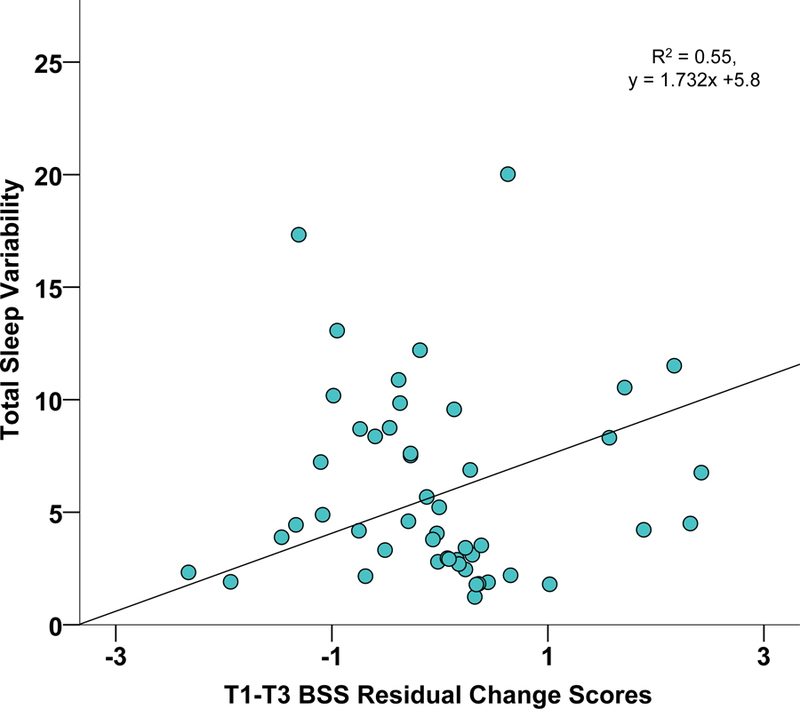
Figure 2b. Scatterplot of Sleep Variability and T3 BSS Residual Change Scores.

Scatterplot of actigraphically-assessed total sleep variability by BSS suicidal ideation residual change scores (T1-T3), adjusting for baseline BDI-II
Abbreviations: BSS, Beck Suicide Scale; T1, Time 1; T3, Time 3
Note: Sleep variability represents the standard deviation of actigraphically-assessed sleep offsets and sleep onsets, summed, as an overall index of sleep timing and irregularity
