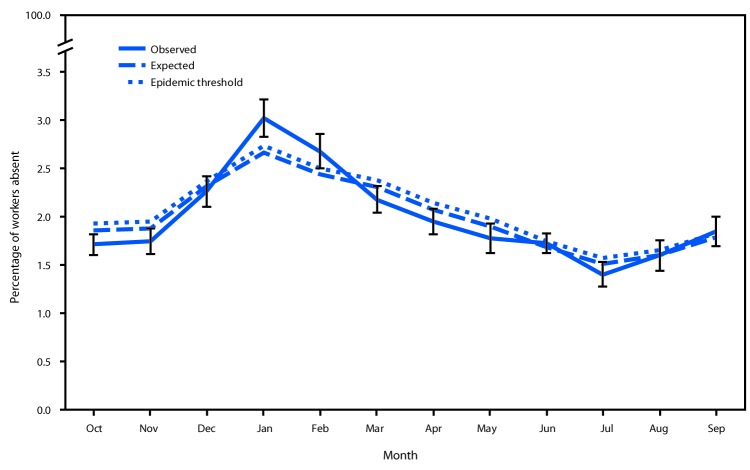
Figure 1.
Observed* versus expected† health-related workplace absenteeism§ among full-time workers¶ — Current Population Survey, United States, 2017–18 influenza season
* Error bars represent 95% confidence intervals (CIs) for point estimates.
† Expected values based on monthly averages for the previous five seasons. Epidemic threshold is the upper 95% CI for expected values.
§ Defined as working <35 hours during the reference week because of illness, injury, or other medical issue.
¶ Defined as employed persons who usually work ≥35 hours per week at all jobs combined.

