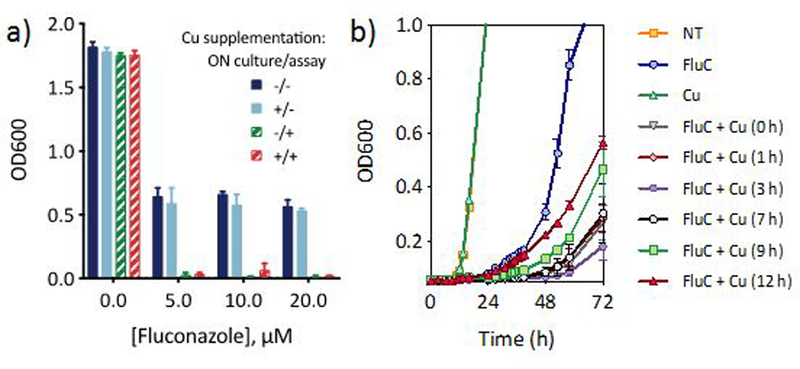
Figure 8 |. Potentiation of fluconazole activity depends on timing of Cu supplementation.

(a) Comparison of cell growth monitored 48 h after fluconazole addition for cells exposed to Cu supplementation during overnight (ON) culture and/or concurrently with fluconazole at time of assay, as designated in the figure legend. Overnight cultures were washed before fluconazole treatment. (b) Growth curve of fluconazole-treated cells without Cu addition (blue circles), or Cu added 0, 1, 3, 7, 9, or 12 h after fluconazole addition. Cu alone does not impact growth (green triangles) relative to untreated control (orange squares). Conditions: [FluC] = 10 µM, [CuSO4] = 10 µM. Data are reported as means with error bars representing standard deviation of three replicate conditions.
