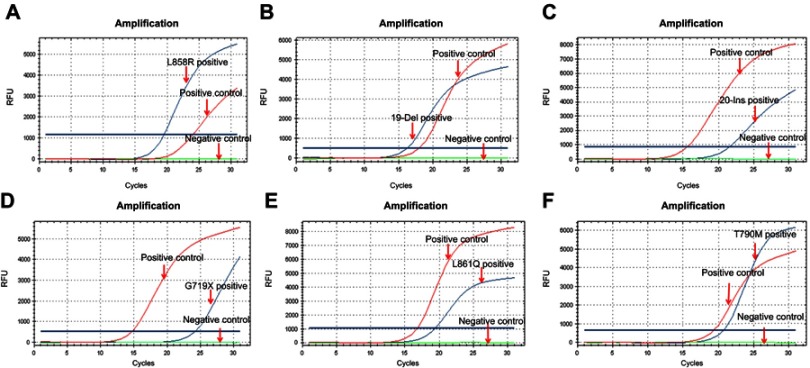
Figure 1.
Representative curves of different mutation subtypes of EGFR gene.
Notes: Representative curves of L858R of exon 21 (A), 19-Del of exon 19(B), 20-Ins of exon 20(C), G719X of exon 18(D), L861Q of exon 21(E), and T790M of exon 20(F). (EGFR gene mutation was detected by ARMS method. The red curves represent positive control which presents the amplification curve, the green curves represent negative control which has no amplification curve, and the blue curves represent the lung adenocarcinoma tissue samples).
Abbreviations: EGFR, epidermal growth factor receptor; ARMS, amplification refractory mutation system.

